

Angle-Resolved Photoemission Spectroscopy
Angle-resolved photoemission spectroscopy, or ARPES, illuminates a surface with photons and measures the kinetic energy and emission direction of each detected electron. With a crystal orientation, photon energy, polarization, work-function convention, and final-state model, those detector coordinates can be converted into a binding energy and crystal momentum. Repeating the measurement builds an occupied energy–momentum intensity map.
The word measures needs care. ARPES does not photograph a pre-existing band structure. A photon removes an electron from an interacting -electron state, the photoelectron propagates through the material and surface, and an analyzer accepts only part of the outgoing distribution. The measured counts combine removal spectral weight, occupation, dipole matrix elements, final-state propagation, escape depth, detector acceptance, background, and resolution.
A bright ridge identifies where electrons are readily removed at a particular energy and momentum. Its position can trace a dispersion, while its width and intensity depend on both the material and the measurement. This page develops equilibrium solid-state ARPES; Pump–Probe Spectroscopy treats measurements after a time-dependent excitation.
Required background. Photoelectron Spectroscopy supplies photon-to-electron energy bookkeeping and binding-energy reference zeros. Spectral Functions supplies removal spectra, matrix-element weights and linewidth interpretation. Bloch’s Theorem supplies crystal-momentum labels, while How Quantum Matter Is Measured supplies the calibration and resolution model relating those quantities to detector coordinates.
Electrons emitted from a crystal
Section titled “Electrons emitted from a crystal”The reviews by Damascelli, Hussain, and Shen (2003) and Sobota, He, and Shen (2021) connect the apparatus to many-body spectra. Begin with the detector: it measures outgoing electrons, so energy conservation and the surface geometry must be established before an intensity ridge can be assigned to a band.
An ARPES experiment combines:
- a photon source with known energy , bandwidth, wavevector , and polarization ;
- an oriented sample in ultrahigh vacuum, often cleaved or grown in situ;
- an electrostatic analyzer that disperses electrons by kinetic energy;
- angular imaging or deflection optics that encode one or two emission angles;
- a detector whose pixels, gain, dead time, and nonlinearities must be calibrated.
The minimally useful raw event coordinates are
supplemented by temperature, sample azimuth and tilt, photon flux, spot position, and preparation history. The subscript labels the analyzer energy reference and calibrated detector angles. Mapping those coordinates to the surface emission direction requires the sample orientation and electron-optical calibration described below.
The familiar three-step description separates:
- optical excitation inside the solid;
- propagation of the excited electron toward the surface;
- transmission through the surface barrier into vacuum.
The three steps help organize the physical processes, but their amplitudes need not factorize (Berglund and Spicer, 1964; Pendry, 1976). One-step photoemission theory treats excitation, surface scattering, and escape coherently, with a time-reversed low-energy-electron-diffraction-like final state. Final-state diffraction and interference can therefore create structure that a plane-wave or three-step picture misses.
Energy and Momentum Kinematics
Section titled “Energy and Momentum Kinematics”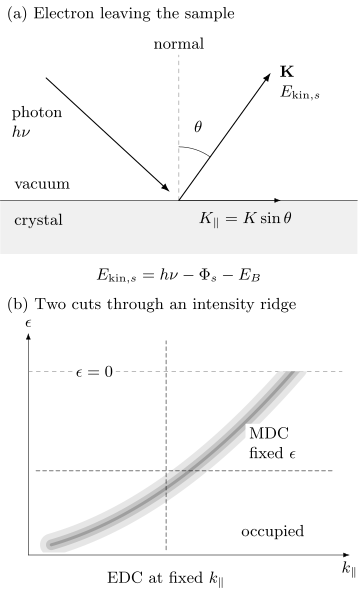
Top: photon absorption ejects an electron at angle from the surface normal. Both the kinetic energy and work function in this panel refer to the sample vacuum; the analyzer reference is introduced separately below. The arrow is the outgoing vacuum wavevector. Bottom: a schematic occupied intensity ridge illustrates a vertical energy-distribution cut (EDC) at fixed and a horizontal momentum-distribution cut (MDC) at fixed energy. The ridge ends at an idealized zero-temperature cutoff; neither its brightness nor its width is a bare-band quantity.
Binding energy
Section titled “Binding energy”For a conducting sample electrically connected to the analyzer, the Fermi levels equilibrate. The binding energy inferred from the analyzer is
where denotes occupied-state binding energy below the Fermi level, is the calibrated analyzer work function, and is referenced to the analyzer vacuum level. If the intrinsic energy variable is measured relative to the chemical potential, this page uses
The sample work function controls the vacuum-level offset and low-energy cutoff, but it does not simply replace the analyzer work function in a Fermi-referenced spectrum when sample and analyzer are in good electrical contact. With no applied sample bias, the kinetic energy immediately outside the sample is
where is the sample work function. The contact potential changes both the kinetic-energy reference and the electron trajectory. Applied bias and the analyzer lens fields must also enter the calibration. An insulating, poorly grounded, or photocharged sample can shift and broaden spectra in a flux-, time-, and position-dependent way, invalidating this equilibrium energy relation.
The energy zero should be checked against a metallic reference in electrical contact, commonly a clean polycrystalline metal. Report photon energy, reference temperature, fit model, drift, and whether sample and reference were measured simultaneously or sequentially.
Vacuum momentum
Section titled “Vacuum momentum”For the following surface kinematics, write , take from the surface normal immediately outside the sample, and let be the surface-plane azimuth. This is the sample-vacuum convention used in the Shen laboratory’s kinematics description. The electron wavevector magnitude there is
A useful numerical conversion is
Its surface-parallel components are
Translational symmetry parallel to an ordered surface gives
where is the initial-state crystal momentum and is a surface reciprocal-lattice vector. In vacuum-ultraviolet ARPES, photon momentum is often small compared with a Brillouin-zone dimension, but it should not be silently neglected in soft-x-ray measurements or precision comparisons.
Converting the analyzer coordinates to the paired surface quantities requires the contact-potential and lens map, sample normal, azimuth, manipulator offsets, detector distortion, and photon-incidence geometry. Using an analyzer energy with an uncorrected surface angle mixes two different kinematic references. A high-symmetry cut is a conclusion of that calibration, not merely a manipulator readout.
Out-of-plane momentum
Section titled “Out-of-plane momentum”The surface breaks translation symmetry normal to itself, so is not exactly conserved. A commonly used free-electron final-state estimate is
where is the empirical depth of the free-electron final-state band bottom below the sample vacuum level, paired here with and the surface angle. This formula is a model, not a calibration identity. Real final states have band gaps, diffraction, self-energy broadening, and surface matching.
Photon-energy scans can identify periodic dispersion in and fit , especially when symmetry planes repeat with the expected reciprocal period. Intensity variation with photon energy alone is insufficient because atomic cross sections and final-state matrix elements also vary strongly.
Let be the normal depth over which the escaping intensity falls by a factor . In a simple damped-plane-wave final state, the amplitude varies as . Its Fourier intensity is Lorentzian in the mismatch of normal wavevectors, with full width at half maximum
This is a model of the intrinsic momentum width, not an exact universal resolution formula. A three-dimensional band is averaged over that range of , which can broaden or shift its energy peak (Strocov, 2003). A nearly two-dimensional band has little energy dispersion over the same range, so its energy peak can remain narrow. That does not mean it has a sharply determined ; a surface-localized state does not have a bulk quantum number at all.
Resolution and Acceptance
Section titled “Resolution and Acceptance”Energy resolution
Section titled “Energy resolution”If independent photon and analyzer responses are approximately Gaussian, their full widths can be combined schematically as
collects electrical noise, drift, and other approximately Gaussian contributions. This quadrature rule does not apply unchanged to asymmetric analyzer response, space-charge tails, or non-Gaussian source spectra.
Temperature broadens the occupied cutoff even for perfect instrumentation. The derivative of a Fermi function has full width at half maximum
The observed Fermi edge is a convolution of this thermal form with the instrumental response. Treating its fitted width as purely instrumental overestimates the analyzer width.
Resolution trades against count rate. Narrow slits, low pass energy, small angular acceptance, and narrow photon bandwidth improve nominal resolution but reduce signal. High photon flux can introduce photoelectron space charge, shifting and broadening the spectrum. A flux series is needed to establish a space-charge-free operating regime.
Momentum resolution
Section titled “Momentum resolution”For a single in-plane component in the emission plane, linearize . Small independent standard deviations then give the following uncertainty; the same relation holds for Gaussian full widths if all widths use that convention:
Angles are in radians, and energy units must agree with those in . Correlated energy and angle errors require their covariance term. The first term usually dominates near normal emission. Real momentum resolution also includes beam divergence, finite spot size on a curved or mosaic sample, sample rotation during a scan, lens aberration, and uncertainty in the crystal orientation.
Pixel spacing is not resolution. Nor is a fitted peak uncertainty the same as resolving two neighboring bands. A complete report distinguishes sampling interval, instrumental point-spread width, intrinsic linewidth, and parameter uncertainty.
The Photoemission Forward Model
Section titled “The Photoemission Forward Model”Within the sudden approximation, the electron escapes rapidly compared with the rearrangement of the remaining system. For one selected band or a regime with a valid scalar factorization, define
The measured map is then more nearly
includes photon flux, illuminated volume, analyzer acceptance, and slowly varying geometry factors; is the photoemission matrix element; is the Fermi occupation; is the full single-particle spectral function, so is the equilibrium electron-removal weight; and are resolution kernels; and is background. The scalar expression does not include all multiorbital interference: overlapping orbitals generally require a spectral matrix and their transition amplitudes. Extrinsic losses and coherent final-state effects can also require a richer model. For a three-dimensional band, the finite- average belongs inside the spectral model. The separated resolution kernels assume negligible energy–angle coupling; otherwise use a joint kernel.
This equation explains why dividing a count map by photon flux does not produce . Matrix elements can vanish, backgrounds can be structured, and deconvolution is ill conditioned. The reliable route is usually to forward-convolve a spectral model and compare it with minimally processed counts.
Spectral function and self-energy
Section titled “Spectral function and self-energy”For a single-band scalar Green function,
Writing
the corresponding spectral function is
For nonzero , this expression is the continuous spectral density of the stated scalar model; an isolated stable pole is recovered as a delta-function limit. Measured width additionally includes resolution, averaging, disorder inhomogeneity, unresolved bands, and final-state effects. Converting a width into a lifetime also requires a pole and factor-of-two convention; Spectral Functions derives the pole-width and decay-time relation.
Energy- and Momentum-Distribution Curves
Section titled “Energy- and Momentum-Distribution Curves”An energy-distribution curve (EDC) holds momentum fixed and plots intensity versus energy. It naturally shows Fermi cutoffs, gaps, satellites, and broad incoherent weight, but its line shape is multiplied by the Fermi function and can have energy-dependent matrix elements and background.
A momentum-distribution curve (MDC) holds energy fixed and plots intensity versus momentum. If:
- the bare dispersion is locally linear;
- the self-energy varies weakly with momentum across the peak;
- the matrix element and background are smooth;
- one isolated band dominates;
then the MDC is approximately Lorentzian. Defining
its intrinsic momentum half width is approximately
Here is an energy slope, often quoted in , rather than a velocity; the bare group velocity is . One can see the width directly by linearizing the denominator of around the peak: it becomes .
The MDC therefore estimates , not automatically the quasiparticle energy half-width. For a well-defined pole and nearly momentum-independent self-energy, define at the pole. Its energy half-width is , the local dispersion slope is , and the pole probability-decay time is . These relations require the same narrow-pole approximation; Exercise 5 works through the factors.
When those assumptions fail, a Lorentzian fit may still look excellent while returning no unique self-energy. Strong momentum dependence, band curvature, nearby branches, gaps, and matrix-element zeros are common failure modes.
EDC and MDC fits should agree under a shared forward model. Large disagreement is diagnostic. Fit residuals, covariance, alternate backgrounds, and resolution convolution matter more than a dense set of smooth peak markers.
Band and Fermi-Surface Mapping
Section titled “Band and Fermi-Surface Mapping”For comparison with theory, Band Structure Workflows explains how to calculate and converge a crystal band structure. Apply the occupation, matrix elements, and resolution model before comparing that calculation with photoemission counts.
Energy–momentum cuts
Section titled “Energy–momentum cuts”An analyzer slit or deflection mode records one momentum direction and energy simultaneously. Rotating the sample or using two-dimensional angular imaging adds the second in-plane momentum. The result is a three-dimensional intensity volume
A displayed cut is one slice or projection of that volume. Record the integration width in the omitted momentum direction; averaging across a curved dispersion broadens features even with a perfect detector.
Fermi-level maps
Section titled “Fermi-level maps”A common Fermi-surface map integrates intensity over a finite energy window around :
The map reveals where occupied dispersions approach the chemical potential, but intensity maxima need not coincide exactly with . The finite window mixes dispersion and linewidth; the Fermi function removes most positive-energy weight; matrix elements can erase entire segments. Track dispersions through the chemical potential, compare polarizations and photon energies, and enforce crystal symmetry only after inspecting the unsymmetrized data.
Three-dimensional mapping
Section titled “Three-dimensional mapping”Varying changes and the sampled final state. Periodic peak-energy motion with the expected reciprocal-lattice period supports bulk dispersion. A state with no discernible periodic energy motion may be two dimensional or surface localized, but matrix-element suppression and broad can also hide dispersion.
A three-dimensional map should report the fitted inner potential, photon-momentum correction, broadening estimate, final-state model, and symmetry landmarks used to set the phase of the scan.
Comparison with calculations
Section titled “Comparison with calculations”Overlaying density-functional bands on raw intensity is a first comparison, not a complete fit. Match:
- crystal structure, surface termination, magnetic order, and spin–orbit convention;
- chemical potential and carrier density;
- surface projection or slab states where relevant;
- orbital characters and polarization selection;
- quasiparticle renormalization and linewidth;
- experimental , acceptance, and resolution.
A rigid energy shift can be useful, but it should not conceal incorrect filling or surface electrostatics. Scaling every band by one factor can conceal orbital-selective renormalization.
Surface Sensitivity
Section titled “Surface Sensitivity”Photoelectrons can lose energy before reaching vacuum. For a simple uniform material, the no-inelastic-loss contribution from depth scales approximately as
For straight trajectories inside the solid, , where is the inelastic mean free path and is the internal propagation angle from the normal. Refraction can make this differ from the vacuum angle . Integrating the exponential shows that of the idealized signal originates within . Elastic scattering, roughness, diffraction, and material-specific loss functions modify that estimate; Seah and Dench (1979) discuss the material and energy dependence of the mean free path.
Surface sensitivity is both an advantage and a liability. ARPES can isolate surface states, interface-grown films, and two-dimensional materials. It can also measure a surface that differs from the bulk through:
- reconstruction or relaxation;
- a termination-specific potential;
- polar charge compensation;
- band bending or a surface accumulation layer;
- adsorbates, oxidation, or beam-induced chemistry;
- cleavage damage, steps, domains, and strain;
- altered magnetic or superconducting order.
Document cleavage or growth temperature, termination evidence, vacuum exposure, spot position, and aging. Repeat on several cleaves or growths. Compare core levels, low-energy electron diffraction, microscopy, or photon-energy dependence where possible. A sharp surface band is not proof of the bulk band structure.
Micro- and nano-ARPES can resolve terraces, domains, and devices, but smaller spots increase sensitivity to drift, topography, local charging, and the angle–position coupling of electron optics.
Matrix-Element Effects
Section titled “Matrix-Element Effects”In a dipole approximation, the transition amplitude contains
or an equivalent momentum-gauge expression under consistent approximations. The amplitude depends on initial-state orbital character, final state, photon energy, polarization, incidence plane, emission direction, sublattice interference, and experimental geometry.
In ideal spinless mirror geometry, the detected final state is even under reflection in the emission plane. The dipole operator is even for polarization in that plane and odd for polarization perpendicular to it. A nonzero transition then selects an even initial state for and an odd one for . This makes polarization a powerful orbital diagnostic. It does not make intensity a direct orbital occupation. Small misalignment, spin–orbit mixing, surface symmetry breaking, and final-state parity complicate the rule.
Atomic subshell cross sections vary strongly with photon energy and can pass through minima (Yeh and Lindau, 1985); solid-state matrix elements also depend on the crystal and measurement geometry (Bansil and Lindroos, 1999). A band that disappears at one photon energy may simply be dark. Conversely, a resonant enhancement can emphasize one elemental or orbital component without proving that the full state is localized on that component.
Circular dichroism and spin-resolved ARPES carry additional wave-function information, but detected photoelectron polarization and dichroism also depend on light incidence, final-state interference, and surface geometry. They are not automatically the initial-state spin texture or Berry curvature.
A robust band inventory uses several photon energies and polarizations. Never symmetrize away an intensity asymmetry before deciding whether it contains orbital or structural information.
Correlation Signatures
Section titled “Correlation Signatures”ARPES is unusually powerful because it can constrain both dispersion and line shape. Correlation claims nevertheless require a reference and a forward model.
DMFT for Quantum Materials explains one way to calculate a correlated spectrum. Its output must still be combined with occupation, matrix elements, surface sensitivity, background, and resolution before comparison with counts.
Renormalized dispersion
Section titled “Renormalized dispersion”A quasiparticle ridge can be narrower in energy and have a lower velocity than a reference band. A mass or velocity enhancement requires a defensible bare dispersion, not merely a straight-line extrapolation chosen to make a kink. Compare realistic weak-coupling bands, high-binding-energy behavior, symmetry-related cuts, and other probes.
Kinks and self-energy
Section titled “Kinks and self-energy”A change in slope accompanied by a linewidth change can be consistent with coupling to a boson or another collective continuum. Matrix-element zeros, overlapping bands, hybridization, and analysis artifacts can also produce apparent kinks; Jung et al. (2016) give a sublattice-interference example in graphene. A strong self-energy analysis checks the mutual consistency of and , causality, temperature or isotope evolution, and the same feature across measurement geometries.
Coherent and incoherent weight
Section titled “Coherent and incoherent weight”A narrow quasiparticle peak plus broad satellites or Hubbard-band-like weight can signal interactions. Absolute coherent residue is difficult to extract because matrix elements, detector acceptance, background, and a finite energy window distort integrated intensity. Spectral-weight transfer with temperature or doping is stronger evidence when normalization is controlled and sum-rule-compatible theory is forward modeled.
Gaps and symmetry breaking
Section titled “Gaps and symmetry breaking”A leading-edge shift is not equal to a gap without modeling the Fermi function, resolution, linewidth, and momentum location. Dividing by a Fermi function amplifies noise above the chemical potential. With finite resolution, pointwise division is not even the exact inverse operation: convolution and multiplication by do not commute.
For an ideal background-free EDC with a constant matrix element, . Since , the symmetrized intensity is
It equals only when the local spectrum is even in energy. An even instrumental kernel then leaves the broadened spectrum, not an unbroadened one. Away from the Fermi momentum, symmetrization can turn one ordinary occupied peak into two peaks around zero. Exercise 6 illustrates that false-gap mechanism. Gap fits should use the full line shape and the measured momentum; Norman et al. (1998) discuss a spectral model used for superconducting spectra.
Density-wave order can produce folded bands, avoided crossings, and coherence-factor patterns. Superconductivity can produce particle–hole-mixed branches and coherence peaks. Surface reconstruction, structural domains, and matrix-element replicas can mimic parts of those patterns. Combine ARPES with diffraction, thermodynamics, transport, and a symmetry-specific model before assigning an ordered phase.
Boundary and topological states
Section titled “Boundary and topological states”A photon-energy-independent dispersing state inside a projected bulk gap is evidence for a surface-localized band. Topological protection additionally requires a validated bulk band topology, connectivity between bulk manifolds, symmetry, and the correct surface projection. An open-looking contour or spin-polarized surface band alone is insufficient.
Sources of uncertainty
Section titled “Sources of uncertainty”Derivative and curvature images can reveal faint ridges but alter noise, widths, and apparent extrema. They are visualization aids. Peak positions and gaps should be fitted to unsmoothed or minimally processed data.
| Inference | Dominant systematics | Minimum control |
|---|---|---|
| binding energy | reference, charging, drift, thermal cutoff | contacted metal, flux and time series |
| in-plane momentum | angular zero, orientation, lens distortion | symmetry landmarks, reciprocal repeats |
| out-of-plane momentum | final state, , photon momentum, | photon-energy periodicity and model range |
| linewidth | resolution, unresolved bands, averaging, background | forward convolution and alternate cuts |
| orbital assignment | polarization, final state, alignment | multiple geometries and calculations |
| bulk band claim | termination, reconstruction, band bending | surface characterization and bulk probe |
| gap | Fermi cutoff, momentum offset, linewidth, symmetrization | reference edge and full line-shape fit |
Exercises
Section titled “Exercises”1. Two vacuum references, one binding energy
Section titled “1. Two vacuum references, one binding energy”A spectrum is taken with and an analyzer work function . A peak is detected at analyzer-referenced . Find its binding energy and intrinsic energy relative to the Fermi level. If the sample work function is , find the kinetic energy just outside the sample and recover the same binding energy using that reference.
Solution
The analyzer-referenced binding energy is
Therefore . The sample-vacuum kinetic energy is . Using the sample pair gives again. Mixing with the analyzer kinetic energy would instead give a spurious . The calculation assumes good electrical contact, no applied bias, and no charging or drift.
2. Parallel momentum and zone reduction
Section titled “2. Parallel momentum and zone reduction”After mapping the analyzer data to the sample vacuum, an electron has and surface emission angle in the plane. Neglect photon momentum. Find and . For a one-dimensional surface period , reduce the result to the first zone .
Solution
The vacuum wavevector is
Thus
The reciprocal period is
Because , subtract one reciprocal vector:
The unreduced and reduced values describe the same surface crystal momentum modulo .
3. Angular contribution to momentum resolution
Section titled “3. Angular contribution to momentum resolution”At normal surface emission, the sample-vacuum energy is and the Gaussian surface-angle full width at half maximum is . Estimate the angular contribution to . Two intrinsically sharp bands are separated by . Does this number alone guarantee that they will be resolved?
Solution
Convert the angle to radians:
At normal emission, and , so
The separation is only times this instrumental width. Resolution also depends on line shape, intrinsic widths, relative intensity, momentum acceptance, and fitting criterion. The nominal angular width alone does not guarantee two resolved peaks.
4. Thermal and instrumental broadening
Section titled “4. Thermal and instrumental broadening”At , estimate the thermal Fermi-edge width. A photon source and analyzer have Gaussian full widths at half maximum of and . Estimate their instrumental quadrature width. Why should the two results not simply be interpreted as independent Lorentzian linewidths of a quasiparticle?
Solution
Using ,
The Gaussian instrumental width is
The Fermi edge is not a Lorentzian, and both contributions are external to the intrinsic spectral linewidth. A correct fit convolves the Fermi function, source spectrum, analyzer response, and intrinsic line shape.
5. From a momentum width to a decay time
Section titled “5. From a momentum width to a decay time”A resolution-corrected MDC has full width for an isolated linear band with bare energy slope . A consistent spectral fit gives . Find , the quasiparticle energy half-width , and the pole probability-decay time. Use .
Solution
The MDC half-width is , so
The energy full width is . Equivalently, the renormalized slope times the momentum half-width gives . Using the full momentum width as a half-width or identifying with changes the inferred time. None of these conversions is justified until unresolved bands, instrumental broadening, and significant momentum dependence of the self-energy have been excluded.
6. An apparent gap produced by symmetrization
Section titled “6. An apparent gap produced by symmetrization”At one momentum away from the Fermi crossing, a normal band has the Lorentzian spectrum
Set , omit resolution and background, and take a constant matrix element. Sketch the occupied EDC and its symmetrized version. Does the pair of symmetrized peaks prove a superconducting gap?
Solution
The occupied EDC is , with a peak near . Symmetrization reflects that occupied peak:
It has peaks at and a strong suppression at zero, although the assumed spectrum is one normal-state peak. The apparent two-sided structure was created by reflecting a spectrum that was not particle–hole symmetric at this momentum. Track the dispersion to its Fermi crossing and fit the original counts before attributing a gap; a symmetric-looking processed plot is insufficient.
References
Section titled “References”- A. Bansil and M. Lindroos, “Importance of Matrix Elements in the ARPES Spectra of BiSrCaCuO”, Physical Review Letters 83, 5154–5157 (1999).
- C. N. Berglund and W. E. Spicer, “Photoemission Studies of Copper and Silver: Theory”, Physical Review 136, A1030–A1044 (1964).
- A. Damascelli, Z. Hussain, and Z.-X. Shen, “Angle-Resolved Photoemission Studies of the Cuprate Superconductors”, Reviews of Modern Physics 75, 473–541 (2003).
- S. W. Jung et al., “Sublattice Interference as the Origin of Band Kinks in Graphene”, Physical Review Letters 116, 186802 (2016).
- M. R. Norman et al., “Phenomenology of the Low-Energy Spectral Function in High- Superconductors”, Physical Review B 57, R11093–R11096 (1998).
- J. B. Pendry, “Theory of Photoemission”, Surface Science 57, 679–705 (1976).
- M. P. Seah and W. A. Dench, “Quantitative Electron Spectroscopy of Surfaces: A Standard Data Base for Electron Inelastic Mean Free Paths in Solids”, Surface and Interface Analysis 1, 2–11 (1979).
- Shen Laboratory, “Angle-resolved Photoemission Spectroscopy”, Stanford University — sample-vacuum kinematics and the connection to removal spectra.
- J. A. Sobota, Y. He, and Z.-X. Shen, “Angle-Resolved Photoemission Studies of Quantum Materials”, Reviews of Modern Physics 93, 025006 (2021).
- V. N. Strocov, “Intrinsic Accuracy in 3-Dimensional Photoemission Band Mapping”, arXiv:cond-mat/0210404v2 (2003) — final-state damping and the limits of assigning a bulk normal momentum.
- J. J. Yeh and I. Lindau, “Atomic Subshell Photoionization Cross Sections and Asymmetry Parameters: ”, Atomic Data and Nuclear Data Tables 32, 1–155 (1985).