

Spectroscopy
Spectroscopy studies a physical system through radiation that it absorbs, emits, scatters, or otherwise modifies. A spectrum is not a photograph of an energy-level diagram. It is a measured response, plotted against frequency, angular frequency, vacuum wavenumber, wavelength, photon energy, magnetic field, or another controlled variable, after state preparation, interaction, propagation, detection, and data processing.
Energy differences locate ideal resonances. Matrix elements and populations control strengths. Dynamics and environments produce widths and shifts. The instrument filters the result. Learning to separate these effects is the central task of spectroscopy.
Enter This Chapter
Section titled “Enter This Chapter”Use this overview first to identify what a measured spectrum can and cannot establish. Then follow the shortest route that matches the quantity you need.
Predict a rate or an integrated intensity. Start with Transition Rates, then choose Oscillator Strengths or Einstein Coefficients for the relevant convention. Absorption and Emission connects those quantities to measured signals.
Decide whether a line appears and what its width means. Use Selection Rules in Spectroscopy for symmetry permissions and Line Shapes and Broadening for lifetime, dephasing, collision, Doppler, and instrumental contributions.
Assign molecular structure. Follow Rotational Spectroscopy or Vibrational Spectroscopy, then use Infrared or Raman Spectroscopy according to the interaction operator and selection rules. For electronic and vibronic structure, continue to Electronic Spectroscopy and Fluorescence and Phosphorescence.
Probe ionization or spin dynamics. Choose Photoelectron Spectroscopy for ionized final states and Magnetic Resonance for spin precession, relaxation, and resonance conventions.
Resolve dynamics or pursue extreme accuracy. Ultrafast Spectroscopy organizes pump–probe and coherent time-domain measurements. Precision Spectroscopy organizes clocks, systematic shifts, uncertainty budgets, and tests of fundamental physics.
Check terminology or experimental practice. Use Spectroscopy Nomenclature for definitions and conventions and Spectroscopy as an Experimental Technique for instruments, calibration, and resolution.
Helpful background. First-Order Transition Probability and Fermi’s Golden Rule distinguish pulse amplitudes from continuum rates. The Fourier Transform explains how time signals become spectra.
The Measurement Chain
Section titled “The Measurement Chain”A measured spectrum depends on more than the isolated-system Hamiltonian. A minimal forward model has five parts.
State preparation
Section titled “State preparation”Specify the initial density operator, ensemble, temperature, polarization, spatial distribution, and any coherences. For a thermal ensemble,
where is the degeneracy included in the chosen level definition. Here is the total population of level , not the population of one degenerate substate. The formula assumes equal thermal population within that level. Nonthermal optical pumping, state selection, chemical kinetics, and population inversion require a different preparation model and may require substate-resolved populations.
Interaction
Section titled “Interaction”Identify the operator that couples the probe to the system. Examples include:
- an electric dipole for leading optical absorption;
- a magnetic dipole for magnetic resonance;
- a polarizability tensor for nonresonant Raman scattering;
- a photoionization operator for electron spectroscopy;
- a density or spin operator for scattering probes.
The word “spectrum” does not determine the operator.
Evolution
Section titled “Evolution”During and after the interaction, the system may undergo coherent motion, spontaneous decay, collisions, dephasing, transport, or chemical conversion. These processes can alter the measured line before the detector receives a signal.
Detection
Section titled “Detection”The detector may count photons or particles, measure transmitted power, heterodyne a field quadrature, record fluorescence versus time, or infer a population after a pulse sequence. Distinct detection observables can assign different weights to the same underlying transitions.
Instrument response and inference
Section titled “Instrument response and inference”Calibration, sampling, finite resolution, background subtraction, and the chosen fit model map the physical response to reported parameters. A compact description is
where is the plotted coordinate, is the instrument response, and is a background model. Deconvolution is an inverse problem, not a purely graphical sharpening operation.
Spectra as Energy Differences
Section titled “Spectra as Energy Differences”Transition frequencies
Section titled “Transition frequencies”Let the unperturbed system satisfy
For a transition from to , define the signed Bohr angular frequency
Absorption from a lower to a higher state requires positive photon energy:
Emission from an upper state to a lower state produces
The measured positive photon frequency should not be confused with a signed index convention such as .
Frequency, wavenumber, wavelength, and energy
Section titled “Frequency, wavenumber, wavelength, and energy”For propagation in vacuum,
with
Here is vacuum wavenumber and is vacuum wavelength. The common spectroscopic unit is a wavenumber, not a frequency. In a material medium, wavelength depends on refractive index, so conventions must be stated.
A specified resonance frequency converts to a wavelength by . A spectral density also requires a Jacobian, which can shift its maximum. If and describe the same integrated signal, then
A symmetric frequency density is therefore not exactly symmetric in wavelength, and its maximum need not occur at . The integrated signal is unchanged when the Jacobian is included. By contrast, a dimensionless response such as transmittance is simply composed with ; it is not a density and receives no Jacobian. Identify the ordinate before changing axes.
A spectrum contains transitions, not levels
Section titled “A spectrum contains transitions, not levels”With levels there can be as many as positive pairwise energy differences before selection rules and preparation are imposed. Conversely, several transitions can coincide at one frequency.
For three ordered levels ,
Such combination differences help construct a self-consistent level scheme. They also show why one peak does not by itself identify two absolute energies. A common additive shift of all leaves every transition frequency unchanged.
Discrete lines and continua
Section titled “Discrete lines and continua”Bound-to-bound transitions produce discrete ideal frequencies. Bound-to-free photoionization and scattering channels have continuum final energies. Dense rovibronic structure, disorder, short lifetimes, and unresolved components can make a discrete manifold look band-like.
A continuous measured spectrum does not prove that the underlying Hamiltonian has no discrete states, and a sharp line does not prove that the system is perfectly isolated.
The line center is model dependent
Section titled “The line center is model dependent”The simple relation uses a specified Hamiltonian. Observed centers can include:
- fine, hyperfine, and isotope shifts;
- Zeeman and Stark shifts;
- recoil and relativistic Doppler effects;
- pressure and collisional shifts;
- radiative corrections;
- mean-field or many-body shifts;
- calibration offsets and unresolved blends.
A precision line center is therefore a comparison between a forward model and data, not an unqualified reading of “the energy difference.”
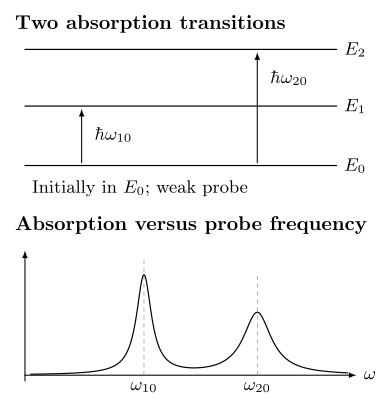
Weak absorption from a system initially in its ground level. Both arrows start at , giving and . The lower panel illustrates two broadened lines; their strengths and widths are illustrative, not determined by the energy diagram. Dashed lines mark the individual transition frequencies; overlap can shift the maxima of their summed response.
Transition Amplitudes and Selection Rules
Section titled “Transition Amplitudes and Selection Rules”First-order amplitude
Section titled “First-order amplitude”Write
If the system begins in , first-order time-dependent perturbation theory gives
This formula separates three ingredients:
- the state’s Bohr phase ;
- the interaction matrix element;
- the temporal spectrum of the applied field.
For a finite pulse, the transition probability has finite bandwidth. Exact energy-conserving delta functions arise only after an appropriate long-time or continuum limit.
Electric-dipole example
Section titled “Electric-dipole example”In the long-wavelength electric-dipole approximation,
For polarization unit vector , the relevant material amplitude contains
Changing polarization can suppress one magnetic sublevel channel and enhance another without changing the field-free level energies.
Selection rules are matrix-element statements
Section titled “Selection rules are matrix-element statements”A selection rule says that a matrix element vanishes under stated symmetry and model assumptions. In representation language,
is necessary for a nonzero matrix element of operator , where is the totally symmetric, or trivial, representation. It is a permission test, not a sufficiency theorem: dynamics, additional symmetries, or accidental cancellation can still make an allowed matrix element vanish.
This statement must name:
- the symmetry group;
- the initial and final state labels;
- the transition operator and multipole order;
- any angular-momentum coupling approximation;
- external fields or symmetry-breaking environments.
“Allowed” means not forced to zero. It does not mean intense. “Forbidden” means zero in the stated approximation, not impossible under every interaction.
From amplitudes to rates
Section titled “From amplitudes to rates”For weak coupling to a continuum of final states, the golden-rule structure is
with normalization, degeneracy sums, field factors, and the density of states defined consistently. The rule is not a universal formula for every spectral peak. Short pulses, strong driving, discrete final states, coherent interference, and non-Markovian dynamics require their own treatments.
Response functions
Section titled “Response functions”In linear response, a weak generalized force coupled to an operator induces
Causality gives . In frequency space,
The absorptive part of a susceptibility, a transition-rate sum, and a correlation spectrum are related descriptions in their shared regime, but their normalization and sign conventions are not interchangeable without a derivation.
Intensities and Lifetimes
Section titled “Intensities and Lifetimes”A strength dictionary
Section titled “A strength dictionary”Several quantities called “intensity” encode different objects:
- peak height depends strongly on linewidth and resolution;
- integrated line area removes profile normalization but still depends on the plotted variable;
- line strength is commonly a squared transition matrix element with a stated angular convention;
- oscillator strength is dimensionless and includes energy and degeneracy factors;
- Einstein coefficient is a spontaneous-emission rate;
- Einstein coefficients multiply a specified radiation energy density;
- cross section converts incident flux into a rate;
- absorbance, absorptance, and transmittance are distinct measured quantities.
Never compare two published “intensities” until their definitions, units, degeneracy averages, polarization sums, and integration variables agree.
A schematic weak spectrum
Section titled “A schematic weak spectrum”For isolated, noninterfering lines, a useful orientation model is
where:
- is the prepared total population of initial level ;
- contains the operator and polarization factors and uses a declared degeneracy convention;
- is a normalized line profile;
- is the center in the chosen model.
For the level-population convention above, equal population of unresolved initial substates and unresolved detection of final substates give, schematically,
The level weight already includes its substates, and the factor in averages over them. Do not multiply their product by an additional degeneracy factor. Polarized or substate-selected preparation requires the resolved populations and matrix elements instead of this average.
This is not universal. Coherent pathways add amplitudes before squaring. Overlapping resonances can interfere. Saturation makes populations depend on the drive. Many-body spectra can contain continua without a one-line decomposition.
Populations and detailed balance
Section titled “Populations and detailed balance”In thermal equilibrium,
Absorption strength therefore changes with temperature even when the Hamiltonian and transition matrix elements do not. Hot bands, stimulated emission, nuclear-spin statistical weights, and partition functions all enter quantitative molecular spectra.
In an optically thin emission measurement, a line’s radiated power is proportional to the upper-state population, photon energy, and spontaneous rate:
This is why a strong emission line need not have the largest transition probability: the emitting population can dominate.
Lifetimes and branching fractions
Section titled “Lifetimes and branching fractions”If an excited state decays through independent weak channels,
The branching fraction for radiative channel is
The radiative quantum yield is
These formulas assume an exponential population decay with time-independent rates. State mixing, trapping, reabsorption, time-dependent environments, and nonexponential kinetics require a broader model.
Weak and strong probing
Section titled “Weak and strong probing”For weak absorption or fluorescence with unchanged populations, the induced rate or absorbed power is often proportional to probe intensity. A field amplitude or heterodyne signal has a different scaling: linear susceptibility relates induced polarization to field amplitude. As the probe perturbs the state appreciably, one must account for:
- depletion or optical pumping;
- saturation and power broadening;
- Rabi oscillations;
- AC Stark shifts;
- multiphoton transitions;
- coherent population trapping.
A line strength inferred from saturated data requires a dynamical fit, not a linear extrapolation by assumption.
Line Shapes
Section titled “Line Shapes”Center, area, width, and shape
Section titled “Center, area, width, and shape”Write one isolated contribution as
Then is the integrated area on the angular-frequency axis. The profile determines peak height, width, wings, and symmetry. Reporting only a fitted center discards dynamical information; reporting only a width without its convention is ambiguous.
Lorentzian profile
Section titled “Lorentzian profile”A normalized Lorentzian with half width at half maximum is
Its angular-frequency full width at half maximum is
At fixed area, increasing lowers the peak height. A broader peak is not automatically a stronger transition.
Gaussian profile
Section titled “Gaussian profile”A normalized Gaussian with angular-frequency standard deviation is
Its full width at half maximum is
Doppler broadening from a one-dimensional Maxwell velocity distribution is Gaussian in frequency to leading nonrelativistic order, with
Voigt and more general profiles
Section titled “Voigt and more general profiles”The convolution of a Lorentzian and a Gaussian is a Voigt profile:
Voigt fitting is common, but not every line is Voigt. Speed-dependent collisions, Dicke narrowing, unresolved hyperfine components, asymmetric interference, spectral diffusion, and many-body thresholds can demand more specific models.
Lifetime and coherence conventions
Section titled “Lifetime and coherence conventions”If the optical coherence decays as
then its Lorentzian angular-frequency half width is . For a two-level Markovian model,
where is the population-relaxation time and is the pure dephasing time. If the lower state is stable and pure dephasing is absent,
These are model-dependent relations, not a derivation from a vague energy–time uncertainty slogan.
Line Shapes and Broadening develops the lifetime, Doppler, collisional, power, instrumental, and beyond-Voigt models and the corresponding fitting cautions.
Broadening and shifting mechanisms
Section titled “Broadening and shifting mechanisms”Separate at least:
- natural or radiative broadening;
- collisional broadening and pressure shifts;
- Doppler broadening;
- transit-time and finite-observation effects;
- power broadening;
- inhomogeneous static distributions;
- spectral diffusion;
- unresolved isotope, hyperfine, rotational, or site structure;
- instrumental resolution and frequency noise.
Several mechanisms can coexist. Widths add only in special parameterizations; profiles generally combine by convolution, averaging, or a joint dynamical model.
Fitting cautions
Section titled “Fitting cautions”A credible line-shape analysis reports:
- the fitted coordinate and units;
- HWHM, FWHM, standard deviation, or another explicit width;
- baseline and instrument-response models;
- the fit window and treatment of neighboring lines;
- parameter covariance and residuals;
- calibration and resolution uncertainties;
- whether the profile was physically derived or chosen empirically.
A small statistical fit error does not cover model misspecification.
Time-Domain Versus Frequency-Domain Spectroscopy
Section titled “Time-Domain Versus Frequency-Domain Spectroscopy”Fourier-related descriptions
Section titled “Fourier-related descriptions”A causal response can be described in time or frequency:
for the convention used here. A decaying oscillation in time becomes a finite-width resonance in frequency. The transform convention, windowing, and one-sided versus two-sided definitions must be recorded.
Equilibrium fluctuation spectra are often written as correlation transforms, for example
Operator order matters in quantum mechanics. Positive- and negative-frequency parts can correspond to absorption and emission processes, and detailed balance depends on the chosen ordering and thermal state.
Continuous-wave spectroscopy
Section titled “Continuous-wave spectroscopy”A narrowband continuous-wave probe scans or locks near a resonance. It offers high frequency resolution when coherence, observation time, and source stability permit. The steady-state signal can nevertheless be altered by saturation, optical pumping, drift, and technical noise.
Pulsed spectroscopy
Section titled “Pulsed spectroscopy”For an unchirped Gaussian field envelope, both temporal and spectral intensities are Gaussian. Their FWHM values obey
A quadratic spectral phase (linear chirp) broadens this Gaussian pulse in time without narrowing its spectral intensity, increasing the product. The number is not a universal FWHM uncertainty bound for arbitrary pulse shapes or phases; general Fourier uncertainty bounds use root-mean-square widths.
Short pulses can create coherent superpositions. Their subsequent phase evolution is observed through:
- Ramsey fringes;
- free-induction decay;
- photon echoes;
- pump–probe signals;
- multidimensional coherent spectra;
- time-resolved photoelectron or fluorescence measurements.
Population and coherence times
Section titled “Population and coherence times”describes population relaxation in a two-level reduction. describes decay of off-diagonal coherence. Pure dephasing can shorten without transferring population:
in the simple Markovian relation given earlier. In multilevel or non-Markovian systems, several population and coherence times can coexist.
Time resolution and frequency resolution
Section titled “Time resolution and frequency resolution”A finite observation window of duration limits the scale of frequency structure that can be distinguished, schematically
This is a Fourier-resolution scale, not a universal lower bound on the statistical error of an estimated line center. With a specified signal model and sufficient signal-to-noise ratio, parameter estimation can locate a center more precisely. Nor is this scale an unavoidable measurement disturbance or the intrinsic lifetime. Apodization changes sidelobes and effective resolution, so the window function belongs in the analysis record.
The two domains are complementary
Section titled “The two domains are complementary”Frequency-domain spectra are often best for precise centers, steady-state line shapes, and dense assignments. Time-domain measurements are often best for causal ordering, coherent motion, relaxation pathways, and nonstationary dynamics. They are mathematically connected but experimentally not interchangeable.
Exercises
Section titled “Exercises”1. Reconstruct a three-level scheme
Section titled “1. Reconstruct a three-level scheme”Three lines are assigned frequencies , , and , with . Show how they can arise from three ordered levels. What part of the level scheme remains undetermined?
Solution
Choose and assign
Then
All three pairwise transitions are consistent with one level triangle. The absolute energy origin remains undetermined: adding the same constant to , , and leaves every line unchanged. Selection rules or preparation may hide one side of the triangle in an actual spectrum.
2. Finite-time resonance
Section titled “2. Finite-time resonance”A weak monochromatic perturbation has the following matrix element between stationary eigenstates of :
for . Show that the transition probability computed from the first-order amplitude has a envelope in detuning . Where are the first zeros?
Solution
The first-order amplitude is proportional to
Therefore, to the leading nonvanishing order,
where . The first zeros occur at
A finite interaction time therefore has finite spectral width. The exact energy-conserving limit appears only as becomes long under the conditions needed for a rate description.
3. Lifetime-limited linewidth
Section titled “3. Lifetime-limited linewidth”An excited state has population lifetime . Assume a stable lower state and no pure dephasing. Find the natural FWHM in ordinary frequency.
Solution
With no pure dephasing,
The Lorentzian angular-frequency FWHM is
Therefore
Using directly as a linewidth in hertz would miss the factor of .
4. Transform-limited pulse bandwidth
Section titled “4. Transform-limited pulse bandwidth”A transform-limited Gaussian pulse has intensity FWHM . Estimate its frequency FWHM. Near , estimate the corresponding wavelength span using the narrow-band linearization
Solution
For a transform-limited Gaussian,
The wavelength estimate is
The wavelength conversion is nonlinear, so the estimate is local and becomes less accurate for very broad fractional bandwidths.
References
Section titled “References”- P. F. Bernath, Spectra of Atoms and Molecules, 5th ed., Oxford University Press, 2025, doi:10.1093/oso/9780197754498.001.0001.
- C. Cohen-Tannoudji, J. Dupont-Roc, and G. Grynberg, Atom–Photon Interactions: Basic Processes and Applications, Wiley, 1992.
- W. Demtröder, Laser Spectroscopy 1: Basic Principles, 5th ed., Springer, 2014, doi:10.1007/978-3-642-53859-9.
- W. Demtröder, Laser Spectroscopy 2: Experimental Techniques, 5th ed., Springer, 2015, doi:10.1007/978-3-662-44641-6.
- C. J. Foot, Atomic Physics, Oxford University Press, 2005.
- HITRAN, Definitions and Units for Line-by-Line Parameters, Harvard–Smithsonian Center for Astrophysics.
- J. M. Hollas, Modern Spectroscopy, 4th ed., Wiley, 2004.
- International Union of Pure and Applied Chemistry, “Spectroscopy,” Compendium of Chemical Terminology, 5th ed., doi:10.1351/goldbook.S05848.
- International Union of Pure and Applied Chemistry, “Spectrum,” Compendium of Chemical Terminology, 5th ed., doi:10.1351/goldbook.08291.
- International Union of Pure and Applied Chemistry, “Wavenumber in Vacuum,” Compendium of Chemical Terminology, 5th ed., doi:10.1351/goldbook.08302.
- A. Kramida, Yu. Ralchenko, J. Reader, and NIST ASD Team, NIST Atomic Spectra Database, Standard Reference Database 78, doi:10.18434/T4W30F.
- R. Loudon, The Quantum Theory of Light, 3rd ed., Oxford University Press, 2000.
- S. Mukamel, Principles of Nonlinear Optical Spectroscopy, Oxford University Press, 1995.