

Spectroscopy: Line Positions, Widths, and Intensities
Spectroscopy is the experimental practice of separating radiation by wavelength or frequency and using the resulting spectrum to identify matter, measure transitions, and test models. It was one of the decisive techniques behind quantum mechanics because atoms and molecules emit and absorb radiation at sharply reproducible frequencies.
This page explains how instruments measure a spectrum and how to read its positions, widths, and strengths. For the discovery of atomic regularities, see Line Spectra, Balmer Formula, and Rydberg Formula. For a modern calculation, see Hydrogen Atom and Hydrogen Spectrum.
What a Spectroscope Does
Section titled “What a Spectroscope Does”A spectroscope takes radiation from a source, spreads it according to wavelength or frequency, and records intensity as a function of that variable. Historically, prisms and diffraction gratings were central dispersive elements. Modern spectrometers may use gratings, interferometers, cavities, lasers, heterodyne detection, frequency combs, or Fourier-transform methods.
The essential output is a spectrum:
intensity versus wavelength, frequency, wavenumber, or photon energyThe independent variable matters. Optical spectroscopy often reports wavelength , frequency , angular frequency , photon energy , or wavenumber . In vacuum,
Historical tables often use wavelength or wavenumber; energy differences are convenient for quantum calculations. Check whether a reported wavelength is in air or vacuum. Also distinguish a line’s location from a spectral density: if and describe the same power interval, then . Changing only the horizontal axis does not correctly transform a spectrum expressed per unit frequency.
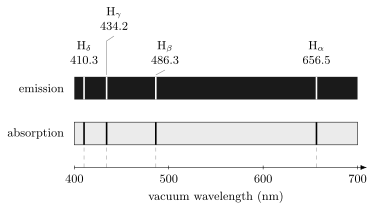
Hydrogen line spectra made the spectral problem concrete: reproducible line positions required an account of discrete transition frequencies, not arbitrary classical radiation from continuously variable orbits.
Emission Spectra
Section titled “Emission Spectra”An emission spectrum is produced when a source radiates at characteristic frequencies. A low-pressure gas discharge is the clean historical example: atoms are excited by collisions or fields, then emit photons as they return to lower-energy states.
Neglecting the atom’s recoil and external shifts, an emitted photon connects an initial state of energy to a lower final state of energy :
That compact formula should not be read back into the nineteenth century too quickly. Early spectroscopists saw bright lines before they had energy eigenstates, Hilbert spaces, or transition amplitudes. The experimental regularity came first.
Emission spectra are powerful because line positions are reproducible fingerprints. Sodium’s yellow doublet, hydrogen’s Balmer lines, mercury lines, and many other examples showed that chemical species carry internal frequency scales. Classical electrodynamics alone did not explain why atoms of the same element should emit such stable discrete patterns.
Absorption Spectra
Section titled “Absorption Spectra”An absorption spectrum is produced when broadband radiation passes through matter and selected frequencies are removed or weakened. In a simple model,
where is the incident intensity and is the optical depth. Absorption lines appear where the medium has allowed transitions that take energy from the radiation field.
The same transition frequency can appear as emission or absorption. In emission, an excited system radiates downward. In absorption, an incoming photon drives an upward transition:
This reciprocity made spectroscopy a chemical and astronomical tool. Laboratory emission lines could be compared with dark solar absorption lines, allowing elements to be identified in remote sources. For quantum mechanics, the key lesson was that the same internal energy differences control both processes.
Resolution and physical linewidth
Section titled “Resolution and physical linewidth”The instrumental resolution describes how well the apparatus separates nearby frequencies. Its resolving power can be expressed as
where the small resolvable separation is defined using a stated criterion. The approximate equality uses . Slit width, observation time, optical design, and detector sampling affect this resolution.
The source also has a physical linewidth, even for a perfect instrument. In an ideal isolated transition from an exponentially decaying upper level of lifetime to a stable lower level, the Lorentzian full width at half maximum is
If both levels have finite lifetimes, both contribute. Collisions and additional dephasing can broaden the line further; a lifetime cannot be inferred from an arbitrary observed width using this formula.
For a nonrelativistic thermal gas, the line-of-sight velocity distribution gives a Gaussian Doppler standard deviation
The measured profile combines these source effects with the instrument’s response, often through a convolution. Unresolved isotope, hyperfine, or Zeeman components can also resemble one broad line. A line’s center, width, and integrated strength therefore answer different physical questions.
Atomic Identification
Section titled “Atomic Identification”Spectroscopy became a method of identification because elements have characteristic patterns of lines. A single line can be suggestive, but reliable identification usually needs a pattern:
- multiple lines with consistent wavelength calibration;
- expected relative strengths under the source conditions;
- absence of plausible contaminant lines;
- agreement across emission or absorption contexts;
- awareness of isotope, ionization, pressure, and temperature effects.
The Bunsen–Kirchhoff program made this logic systematic. A clean flame or discharge source, a dispersive spectroscope, and careful comparison of line positions turned spectra into chemical evidence. The discovery of cesium and rubidium by their spectral lines made the point dramatically: spectroscopy could identify matter that ordinary chemical inspection had missed.
Modern databases continue this work with critically evaluated wavelengths, energy levels, and transition probabilities. The experimental context remains essential. A database line list is not automatically an identification; it is a reference against which calibrated, modeled spectra are compared.
Quantum Transitions
Section titled “Quantum Transitions”In modern quantum mechanics, spectral lines are transitions between states. The positive photon frequency is approximately the magnitude of an energy difference, with recoil and external shifts neglected:
But a frequency condition is not enough. The strength of a transition depends on a matrix element. For an electric-dipole transition, the relevant operator is proportional to the dipole moment , and the strength involves quantities of the form
where is the light polarization. If symmetry forces this matrix element to vanish, the transition is forbidden in that approximation.
The calculation has several distinct ingredients:
- energy eigenvalues give line positions;
- matrix elements give transition strengths;
- angular momentum and parity give selection rules;
- perturbation theory gives transition probabilities and rates;
- line shapes reveal lifetimes, motion, collisions, and environments.
For calculations, use transition rates in light–matter interaction, dipole transitions, and the Wigner–Eckart theorem.
Modern Spectroscopy Bridge
Section titled “Modern Spectroscopy Bridge”Modern spectroscopy is much broader than nineteenth-century optical line observation. It includes microwave spectroscopy, infrared spectroscopy, Raman spectroscopy, laser spectroscopy, magnetic resonance, photoelectron spectroscopy, X-ray spectroscopy, neutron spectroscopy, and precision frequency metrology.
The quantum-mechanical theme is shared:
prepare a system, drive or observe a transition, resolve frequencies,and infer structure from energies, matrix elements, and line shapes.Laser spectroscopy made this theme extraordinarily precise. Narrow linewidths, tunability, saturated absorption, laser cooling, trapped ions, atomic clocks, and frequency combs turned spectroscopy into a precision test of quantum electrodynamics, fundamental constants, and many-body environments.
At the same time, spectroscopy remains model-dependent. A peak must be assigned to a transition, molecule, isotope, material band, resonance, or background process. The apparatus produces data; quantum theory supplies the state and transition framework that makes the data interpretable.
Common pitfalls
Section titled “Common pitfalls”A line strength is not just a population. Transition matrix elements, optical depth, collection geometry, and detector response also matter. Compare calibrated strengths under stated source conditions.
A wavelength match needs context. Check several lines, possible contaminants, and the air or vacuum convention before identifying a species. A database supplies reference values, not a substitute for this comparison.
Spectroscopy includes continua. Ionization thresholds, bands, and broad resonances carry useful information too. Sharp atomic lines do not imply that every spectrum consists only of discrete energies.
Exercises
Section titled “Exercises”- A spectral line is measured at vacuum wavelength . Compute its frequency to two significant figures.
Solution
Use with and :
To two significant figures, .
- A spectrometer has resolving power near . Estimate the wavelength separation it can resolve.
Solution
Use :
- Why is a line position not enough to predict line intensity?
Solution
The line position is mainly set by an energy difference. The intensity also depends on populations, transition matrix elements, selection rules, line broadening, optical depth, detector response, and source geometry. Two transitions can have similar frequencies but very different strengths.
- Why did absorption spectra help connect laboratory spectroscopy to astronomy?
Solution
Atoms and ions can absorb at the same characteristic transition frequencies at which they emit. Laboratory emission lines could therefore be compared with dark absorption lines in sunlight or starlight. Matching line patterns made it possible to identify elements in remote objects.
References
Section titled “References”- J. J. Balmer, “Notiz ueber die Spectrallinien des Wasserstoffs,” Annalen der Physik und Chemie 25, 80-87, 1885.
- W. Demtröder, Laser Spectroscopy, Vol. 1: Basic Principles, 4th ed., Springer, 2008.
- G. Herzberg, Atomic Spectra and Atomic Structure, Dover, 1944.
- G. Kirchhoff and R. Bunsen, “Chemical Analysis by Spectrum-Observations,” Philosophical Magazine 20, 89-109, 1860.
- A. Kramida, Yu. Ralchenko, J. Reader, and NIST ASD Team, NIST Atomic Spectra Database, version 5.12 (2024), NIST Standard Reference Database 78, DOI: 10.18434/T4W30F.
- J. R. Rydberg, “Recherches sur la constitution des spectres d’emission des elements chimiques,” Kungliga Svenska Vetenskapsakademiens Handlingar 23, 1-177, 1890.