

Infrared Spectroscopy
Infrared spectroscopy measures how matter absorbs, emits, or reflects radiation in spectral regions where molecular rotations, vibrations, and low-lying electronic or collective excitations occur. In molecular vibrational spectroscopy, the leading coupling is usually electric dipole: an incident field drives a transition only when the molecular dipole operator has a nonzero matrix element between the initial and final states.
A measured spectrum combines molecular transition strengths with populations, light propagation, and the instrument response. This page connects those layers for molecular vibrational absorption, including FTIR and ATR.
Required background. Vibrational spectroscopy supplies normal-mode and anharmonic band assignments; absorption and emission supplies cross sections and Beer–Lambert propagation. For bulk electronic and collective responses, see terahertz and infrared probes.
Infrared Coordinates and Windows
Section titled “Infrared Coordinates and Windows”Wavenumber and wavelength
Section titled “Wavenumber and wavelength”Mid-infrared molecular spectra are commonly plotted against vacuum wavenumber
usually in . Wavelength in micrometres is related by
The photon energy is
Many IR plots place high wavenumber at the left and let the axis decrease toward the right. That convention reverses the direction of a usual increasing-frequency graph. Always read the tick labels before interpreting “left” or “right.”
Near-, mid-, and far-infrared
Section titled “Near-, mid-, and far-infrared”The boundaries between infrared subregions are conventional rather than fundamental. A common laboratory partition is:
| Region | Approximate wavenumber | Frequent molecular information |
|---|---|---|
| Near-infrared | to | Overtone and combination bands, especially X–H motion |
| Mid-infrared | to | Many molecular fundamentals and characteristic-group bands |
| Far-infrared | to roughly | Low-frequency vibrations, torsions, intermolecular modes, lattice modes, and some rotations |
Instrument sources, beam splitters, windows, detectors, and calibration methods change across these ranges. A quoted region boundary should therefore be treated as a working convention, not as a discontinuity in molecular physics.
Electric-Dipole Coupling
Section titled “Electric-Dipole Coupling”Long-wavelength interaction
Section titled “Long-wavelength interaction”If the field varies negligibly across a molecule, the leading interaction is
For a linearly polarized monochromatic component,
the transition amplitude contains
The resonance condition locates a possible transition; determines whether the electric-dipole channel survives and how strongly it is driven. Frequency matching alone does not create absorption.
Magnetic-dipole, electric-quadrupole, vibronic, and collision-induced channels can matter when the electric-dipole term vanishes or exceptionally high sensitivity is available. Calling a band “forbidden” is always shorthand for a declared leading operator and symmetry limit.
Dipole surface and nuclear motion
Section titled “Dipole surface and nuclear motion”Within a one-surface Born–Oppenheimer treatment, the electronic state defines a geometry-dependent molecular dipole surface
The vibrational transition moment is then
This expression separates two physical ingredients:
- the nuclear wavefunctions and their overlap; and
- the dipole surface generated by the electrons and nuclei.
A vibrational spectrum is therefore not determined by the potential-energy surface alone. Energies require the nuclear Hamiltonian; infrared intensities also require the dipole surface.
Dipole Moment Derivative
Section titled “Dipole Moment Derivative”Linear expansion in normal coordinates
Section titled “Linear expansion in normal coordinates”Near an equilibrium geometry, define the molecule-fixed dipole derivatives
The local expansion is then
Here is a dimensional mass-weighted normal coordinate, with mode Hamiltonian . For a harmonic fundamental,
The leading transition-moment component is therefore
The mode is first-order infrared active if at least one component satisfies
The derivative’s numerical value depends on how is normalized. A reported quantum-chemistry “IR intensity” also depends on program conventions and unit conversions. The physical transition moment is invariant only when the coordinate normalization, derivative, and oscillator matrix element are used consistently.
Permanent dipole versus dipole change
Section titled “Permanent dipole versus dipole change”The equilibrium dipole does not decide vibrational infrared activity.
- Carbon dioxide has no permanent dipole, yet its antisymmetric stretch and bend change the dipole and are infrared active.
- A polar molecule can have a normal mode whose dipole derivative vanishes by symmetry.
Pure rotational electric-dipole absorption and vibrational electric-dipole absorption therefore use related but different criteria: the former probes a permanent molecule-fixed dipole, while the latter probes a transition moment, whose leading harmonic term is a dipole derivative.
Isotropic and polarized samples
Section titled “Isotropic and polarized samples”For a fixed molecular transition moment and field polarization ,
An isotropic orientational average gives
In a single crystal, oriented film, molecular beam, or stretched polymer, that average is inappropriate. Polarization-dependent absorbance can reveal the direction of a transition dipole relative to a laboratory or crystal axis. The measured dichroism also depends on orientation distributions, Fresnel factors, and sampling geometry.
Infrared-Active Modes
Section titled “Infrared-Active Modes”Symmetry criterion
Section titled “Symmetry criterion”The general electric-dipole condition is
For a nondegenerate, totally symmetric vibrational ground state and a one-quantum fundamental, this reduces to
The notation says that the mode must transform like at least one component of the dipole vector. It does not say that every non-totally-symmetric mode is active or that every totally symmetric mode is inactive. The answer depends on the point group and its vector representations.
Water and carbon dioxide
Section titled “Water and carbon dioxide”For water, take the axis along the axis and the molecule in the plane. Its two modes and one mode transform like allowed dipole components, so all three fundamentals are infrared active.
Linear carbon dioxide has:
The gerade symmetric stretch is electric-dipole inactive from the gerade ground state at leading order. The ungerade bend and antisymmetric stretch are active. An isotope pattern or environment that actually breaks inversion can change this restriction. Symmetry-preserving anharmonic mixing cannot create a gerade-to-gerade electric-dipole transition; a different interaction operator has its own parity rule.
Allowed does not mean strong
Section titled “Allowed does not mean strong”Symmetry answers whether a matrix element is forced to zero. It does not set its magnitude. An allowed mode can be weak because
is small. Conversely, a nominally forbidden state can borrow intensity from a nearby bright state only when their exact symmetries permit that mixing. Concentration, lower-state population, isotopic abundance, orientation, band overlap, and detector response further separate an intrinsic line strength from an observed peak height.
Selection-Rule Hierarchy
Section titled “Selection-Rule Hierarchy”Harmonic vibrational rule
Section titled “Harmonic vibrational rule”With harmonic states and only the dipole term linear in ,
For absorption from a cold ground state, this selects fundamentals. The rule is approximate because a real potential and dipole surface contain higher orders.
A diagonal quadratic dipole term connects harmonic states with
A cross term with instead changes both mode occupations by . Anharmonic wavefunctions also mix harmonic number states, subject to exact symmetry. These mechanisms produce overtone and combination intensity, developed in Vibrational Spectroscopy.
Hot bands
Section titled “Hot bands”A hot band starts in a thermally populated excited state. For a mode of wavenumber ,
before degeneracy and rotational factors are included. Low-frequency modes can therefore show appreciable hot-band structure at room temperature. Heating changes populations and line shapes; it does not alter the exact symmetry of an isolated equilibrium Hamiltonian.
Rotational and parity rules
Section titled “Rotational and parity rules”In a gas, total angular momentum and parity add further conditions. A simple electric-dipole transition obeys the angular rule
with excluded, but molecular projections, parity, electronic angular momentum, vibrational angular momentum, and nuclear-spin statistics decide which branches and subbranches actually exist.
The compact mnemonic must not be applied without the rest of the state labels. A diatomic vibrational band has P and R branches but no Q branch; a degenerate bend of a linear polyatomic can have a strong Q branch.
Environment can relax molecular labels
Section titled “Environment can relax molecular labels”In liquids and amorphous solids, free rotation is interrupted and rotational quantum numbers cease to organize resolved lines. In crystals, the site group or factor group may differ from the free-molecule point group. Surface selection rules can favor dipole components with particular orientations. Selection rules remain symmetry statements, but the relevant Hamiltonian and symmetry group have changed.
From Transition Moment to Measured Area
Section titled “From Transition Moment to Measured Area”Line strength and profile
Section titled “Line strength and profile”For thermal populations, write the net absorption cross section per molecule of one specified isotopologue as
with normalized profile
Then
The integrated strength contains the transition moment, lower-state population fraction, degeneracy, stimulated-emission correction, and the adopted spectral-coordinate convention. Peak height additionally depends on the line profile and instrument response. Two spectra can have the same integrated area and different maxima.
Column density and optical depth
Section titled “Column density and optical depth”For a uniform, nonemitting sample in a justified narrow-beam transmission model,
where is the total column density of that isotopologue, summed over its internal states. Using a lower-state column here would count its population fraction twice. Integration gives
HITRAN tabulated line intensities additionally include a reference terrestrial isotopic abundance. To use them with this isotopologue column, first divide out that abundance. Equivalently, retain the tabulated intensity and use the total molecular-species column when the sample has that reference isotope mixture. Do not apply the isotope fraction twice.
Base-ten absorbance is
For a homogeneous solution under Beer–Lambert conditions,
This relation is not automatic for an ATR spectrum, diffuse reflectance, strongly scattering powder, saturated band, chemically associating solution, or detector signal contaminated by emission. The general propagation derivation and its limits are given in Absorption and Emission.
What an FTIR Instrument Measures
Section titled “What an FTIR Instrument Measures”Interferogram
Section titled “Interferogram”A Fourier-transform infrared spectrometer commonly uses an interferometer to encode many spectral components into detector power as a function of optical path difference . After subtracting the unmodulated component, an idealized even interferogram has the cosine-transform form
The spectrum is recovered by a Fourier transform, with phase correction and instrument-specific processing. A sample spectrum is usually ratioed to a background or reference spectrum to estimate transmittance or a related response.
The interferogram is not a spectrum with the horizontal axis relabeled. The Fourier transform, sampling grid, phase treatment, and instrument line shape are part of the measurement model.
Resolution and maximum path difference
Section titled “Resolution and maximum path difference”If the interferogram is measured only to a maximum optical path difference , the nominal resolution scale is
up to the instrument’s chosen resolution criterion and apodization convention. Longer path difference provides finer spectral resolution. Zero-filling creates a denser plotted grid but does not add independent resolution.
Truncating an interferogram produces sidelobes in the instrument line shape. Apodization suppresses sidelobes at the cost of broadening the central response. The reported resolution should name the apodization and line-shape convention when nearby features or widths matter.
For a linear instrument with response kernel , background spectrum , and true transmittance , the measured ratio is
It reduces approximately to only when is sufficiently smooth across the response width and is normalized. Taking a logarithm does not commute with this smoothing. Unresolved opaque lines can therefore have a much smaller apparent absorbance area than their true area.
Background and atmospheric subtraction
Section titled “Background and atmospheric subtraction”The measured response includes source spectrum, beam-splitter throughput, optical windows, detector response, purge quality, and sample geometry. A background scan removes these factors only to the degree that they remain stable between measurements.
Water vapor and carbon dioxide in the beam path produce common narrow residuals when sample and background atmospheres differ. Temperature drift, source drift, changing purge, detector nonlinearity, and moving fringes can also survive ratioing. Removing a reproducible atmospheric line is a data processing step, not evidence that the sample lacks absorption there.
Sampling Geometries
Section titled “Sampling Geometries”Transmission
Section titled “Transmission”In transmission, the detector measures radiant power that passes through the sample and its windows. The method is conceptually closest to Beer–Lambert attenuation, but only after accounting for:
- reflection at interfaces;
- scattering and diffraction;
- absorption by windows, solvent, or matrix;
- nonuniform thickness or concentration;
- multiple internal reflections and interference fringes;
- detector dynamic range; and
- sample emission at elevated temperature.
A band with transmittance indistinguishable from zero is optically opaque under those conditions. Its clipped peak cannot yield a reliable integrated absorbance merely by taking a larger logarithm. A shorter path, lower concentration, isotopic dilution, or weaker band may be required.
Attenuated total reflection
Section titled “Attenuated total reflection”In attenuated total reflection (ATR), light undergoes total internal reflection in a high-index internal-reflection element. An evanescent field samples material in contact with the interface.
For vacuum wavelength , crystal index , sample index , and incidence angle above the critical angle, define the field-amplitude penetration depth by
For an ideal lossless two-medium interface,
This is not automatically the effective Beer–Lambert path length. Absorption, anomalous dispersion, polarization, number of reflections, contact quality, and wavelength-dependent Fresnel factors all alter the ATR response. Because grows with wavelength, an uncorrected ATR spectrum can have intensity ratios different from a transmission spectrum.
ATR is surface-weighted rather than magically surface-exclusive. The sampled depth depends on optical constants and geometry, and poor contact can suppress or distort bands.
Reflectance and diffuse-reflectance methods
Section titled “Reflectance and diffuse-reflectance methods”Specular reflectance measures an optical boundary-value problem. Peak shapes depend on both real and imaginary parts of the refractive index and can be derivative-like rather than absorption-like. Extracting optical constants may require Fresnel modeling and Kramers–Kronig-consistent analysis.
Diffuse reflectance from powders combines absorption and multiple scattering. Transforms such as Kubelka–Munk rely on assumptions about an optically thick, homogeneous, diffusely scattering medium. A transformed reflectance trace should not be labeled as transmission absorbance without its model.
Rovibrational Structure
Section titled “Rovibrational Structure”One vibrational band, many rotational lines
Section titled “One vibrational band, many rotational lines”An isolated gas-phase molecule usually rotates while it vibrates. A vibrational transition therefore generates a set of rotationally resolved lines. In the simplest linear-rotor approximation with the same rotational constant in both vibrational states,
Here has , has , and is the band origin. For a simple diatomic band there is no Q branch at .
Real upper- and lower-state rotational constants differ, so line spacings are not exactly uniform. Centrifugal distortion, spin structure, isotope mixtures, Coriolis coupling, and resonances add further structure. Those derivations are developed in Rovibrational Coupling.
Band origin versus envelope maximum
Section titled “Band origin versus envelope maximum”The most intense point in a gas-phase band need not equal . Rotational populations and line-strength factors distribute area among branches, while finite resolution and broadening merge them into an envelope. A prominent Q branch can lie near the origin in some bands, but its presence is a symmetry and angular-momentum result, not a universal marker.
Reporting the envelope maximum as a vibrational frequency without the resolution, temperature, and branch model can introduce a systematic shift.
Condensed-phase bands
Section titled “Condensed-phase bands”In liquids and amorphous solids, rotational fine structure is usually lost. Collisions, orientational disorder, site distributions, hydrogen bonding, and collective interactions broaden and shift the feature. In crystals, factor-group splitting, longitudinal–transverse optical splitting, and polarization selection can become important.
The absence of resolved P and R branches does not mean that molecular rotation was never part of the microscopic dynamics. It means the free-rotor quantum numbers no longer organize long-lived, spectrally resolved states.
Characteristic Groups and the Fingerprint Region
Section titled “Characteristic Groups and the Fingerprint Region”A useful but approximate partition
Section titled “A useful but approximate partition”The mid-infrared spectrum is often divided near . Above that value, several local stretching motions fall into recognizable characteristic-group ranges. Between approximately and , bending, skeletal, and coupled motions often produce a denser pattern called the fingerprint region.
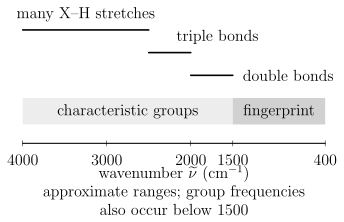
A conventional mid-infrared orientation, with wavenumber decreasing from left to right. The boundaries and group labels are assignment aids, not exact selection rules. The IUPAC fingerprint-region convention is often –, and characteristic group frequencies can also occur inside it.
The phrase “fingerprint” should not be read too literally. The region is rich because many normal modes mix local stretches, bends, torsions, and skeletal coordinates. Similar molecules can have closely related patterns, while the same molecule can shift with phase, conformation, temperature, solvent, hydrogen bonding, crystal form, or isotope composition.
Characteristic frequencies are correlations
Section titled “Characteristic frequencies are correlations”A correlation table is empirical structure–spectrum knowledge. It can suggest that a feature is compatible with a carbonyl, O–H, N–H, C–H, or other local motion. It does not replace a normal-mode calculation or a complete spectral assignment.
Band position depends on:
- local force constants and reduced-mass participation;
- conjugation, charge, and electronic structure;
- hydrogen bonding and coordination;
- vibrational coupling and resonance;
- conformer and phase;
- isotope substitution; and
- experimental calibration and sampling geometry.
Use ranges to generate hypotheses, then test those hypotheses against the whole spectrum and independent chemical information.
Library matching
Section titled “Library matching”A defensible library comparison should match, as closely as possible:
- chemical form, stereochemistry, and isotopic composition;
- gas, liquid, solution, matrix, amorphous, or crystalline phase;
- transmission, ATR, or reflectance geometry;
- spectral range and resolution;
- temperature and pressure;
- baseline and normalization method; and
- known contaminants or matrix bands.
Correlation or machine-learning similarity scores do not by themselves establish identity. Inspect which peaks drive the score, whether expected bands are absent, and whether mixtures or phase changes explain the residual.
Mixtures as an inverse problem
Section titled “Mixtures as an inverse problem”For a noninteracting homogeneous mixture under Beer–Lambert conditions,
This linear model supports least-squares or constrained spectral unmixing. Identifiability fails when reference spectra are nearly collinear, the baseline is flexible enough to absorb real bands, strong components saturate, or chemical interactions change the component spectra. A small fit residual is not proof that the recovered concentrations are unique.
Common Artifacts and Mistakes
Section titled “Common Artifacts and Mistakes”| Problem | Spectral symptom | Diagnostic or remedy |
|---|---|---|
| Atmospheric water or carbon dioxide mismatch | Narrow positive and negative residuals at familiar gas lines | Improve purge and compare sample and background timing |
| Interference fringes | Approximately periodic oscillation in wavenumber | Change thickness or angle and model multiple reflections |
| Scattering from particles or rough surfaces | Sloping or curved baseline, distorted strong bands | Change particle size or geometry and use a scattering-aware model |
| ATR contact variation | Irreproducible intensities with similar positions | Control pressure, contact area, crystal cleanliness, and sample surface |
| Optical saturation | Flat-bottomed or clipped strong bands | Shorten path or reduce concentration; do not fit the clipped core |
| Detector or source changeover | Step or response discontinuity | Inspect instrument channels and reference procedure |
| Overaggressive baseline subtraction | Negative lobes or removed broad bands | Fit controls and propagate baseline uncertainty |
| Unresolved gas rotational structure | Envelope maximum mistaken for band origin | Increase resolution or fit a rovibrational model |
Exercises
Section titled “Exercises”Exercise 1: Convert a carbonyl-region band
Section titled “Exercise 1: Convert a carbonyl-region band”An absorption maximum occurs at . Find its vacuum wavelength in micrometres and photon energy in electronvolts. Use .
Solution
The wavelength is
The photon energy is
The energy is much smaller than a typical visible photon energy but matches a molecular vibrational scale.
Exercise 2: Fundamental transition moment
Section titled “Exercise 2: Fundamental transition moment”For one mass-weighted harmonic mode,
with all other dipole components independent of . Find the leading transition moment and its isotropic polarization average.
Solution
The constant term cannot connect orthogonal harmonic states. Therefore
The molecular transition moment lies along , so
For an isotropic ensemble and one fixed linear polarization,
The result assumes the stated mass-weighted coordinate convention.
Exercise 3: Carbon dioxide activity
Section titled “Exercise 3: Carbon dioxide activity”Carbon dioxide has a gerade vibrational ground state. Use inversion parity to classify the leading electric-dipole infrared activity of its symmetric stretch, bend, and antisymmetric stretch.
Solution
The electric dipole is ungerade. Starting from a gerade ground state, the triple product
can be gerade only when the final vibrational state is ungerade. The bend and antisymmetric stretch can therefore be infrared active. The symmetric stretch is inactive at leading electric-dipole order.
Parity is necessary but the complete vector-representation condition is still required in a general point group.
Exercise 4: Overtone mechanism
Section titled “Exercise 4: Overtone mechanism”Suppose the vibrational potential is harmonic but
Which term can drive ? Would the answer change if the dipole were strictly linear but the potential were anharmonic?
Solution
For harmonic states,
The quadratic dipole term therefore drives the overtone through electrical anharmonicity.
If the dipole is linear but the potential is anharmonic, the exact wavefunctions mix harmonic number states. Then the matrix element of between the exact ground and overtone states can be nonzero. That is mechanical anharmonicity, provided symmetry allows it. For an even potential and an odd, strictly linear dipole, the exact ground and second excited states are both even, so this overtone remains forbidden. Real allowed overtones can contain both electrical and mechanical contributions.
Exercise 5: Transmission and absorbance
Section titled “Exercise 5: Transmission and absorbance”A sample has measured transmittance at one wavenumber. Find its decadic absorbance and Napierian optical depth. If Beer–Lambert conditions hold with and , find the molar decadic absorption coefficient.
Solution
The decadic absorbance is
The optical depth is
Finally,
The numerical result is meaningful only if reflection, scattering, concentration chemistry, and detector nonlinearity are negligible or corrected.
Exercise 6: FTIR path difference
Section titled “Exercise 6: FTIR path difference”An FTIR scan reaches a maximum optical path difference of . Estimate its nominal wavenumber-resolution scale. What happens if the interferogram is zero-filled to four times as many points?
Solution
The scale is
The exact quoted resolution depends on apodization and the instrument’s criterion. Fourfold zero-filling makes the transformed sampling grid four times denser, but it does not narrow the instrument line shape or add independent information. The physical resolution remains set by the measured path range.
Exercise 7: ATR penetration depth
Section titled “Exercise 7: ATR penetration depth”For an ATR measurement at , take , , and . Verify total internal reflection and calculate the field-amplitude penetration depth.
Solution
The critical angle satisfies
so
Because , total internal reflection occurs. The penetration depth is
This is the field-amplitude scale under the ideal interface model, not a universal transmission-equivalent path length.
Exercise 8: An unresolved dark line
Section titled “Exercise 8: An unresolved dark line”A normalized, nonnegative instrument response averages two equally weighted spectral intervals with flat incident intensity. Their optical depths are and . Find the apparent optical depth and compare it with the mean true optical depth. Explain the direction of the bias.
Solution
The measured transmittance is , so , whereas the mean true optical depth is . Since is convex, Jensen’s inequality gives . The transparent part dominates the unresolved transmitted power. This inequality assumes a nonnegative averaging kernel; unapodized FTIR sidelobes can have negative lobes and require the full instrument model.
References
Section titled “References”- P. F. Bernath, Spectra of Atoms and Molecules, 5th ed., Oxford University Press, 2025, doi:10.1093/oso/9780197754498.001.0001.
- H. Goenaga Infante, J. Warren, J. Chalmers, G. Dent, J. L. Todoli, J. Collingwood, N. Telling, M. Resano, A. Limbeck, T. Schoenberger, D. B. Hibbert, A. Le Gresley, K. Adams, and D. Craston, “Glossary of Methods and Terms Used in Analytical Spectroscopy,” Pure and Applied Chemistry 93, 647–776 (2021), doi:10.1515/pac-2019-0203.
- P. R. Griffiths and J. A. de Haseth, Fourier Transform Infrared Spectrometry, 2nd ed., Wiley, 2007, doi:10.1002/047010631X.
- N. J. Harrick, Internal Reflection Spectroscopy, Interscience, 1967.
- G. Herzberg, Molecular Spectra and Molecular Structure. II. Infrared and Raman Spectra of Polyatomic Molecules, Van Nostrand, 1945.
- HITRANonline, Line-by-Line Definitions and Units and Cross-Section Definitions, accessed 2026-07-22.
- International Union of Pure and Applied Chemistry, “fingerprint region”, Compendium of Chemical Terminology, 5th ed., online version 5.0.0, 2025, doi:10.1351/goldbook.08604.
- International Union of Pure and Applied Chemistry, “transmittance” and “Beer–Lambert law”, Compendium of Chemical Terminology, 5th ed., online version 5.0.0, 2025.
- M. Milosevic, Internal Reflection and ATR Spectroscopy, Wiley, 2012.
- Z. Movasaghi, S. Rehman, and I. U. Rehman, “Fourier Transform Infrared Spectroscopy of Biological Tissues,” Applied Spectroscopy Reviews 43, 134–179 (2008), doi:10.1080/05704920701829043.
- NIST Chemistry WebBook, SRD 69, Carbon dioxide gas-phase infrared spectrum, accessed 2026-07-22.
- NIST Sensor Science Division, Fourier Transform Infrared Spectrophotometry Facility, accessed 2026-07-22.
- E. B. Wilson Jr., J. C. Decius, and P. C. Cross, Molecular Vibrations: The Theory of Infrared and Raman Vibrational Spectra, McGraw–Hill, 1955; Dover reprint, 1980.