

Fluorescence and Phosphorescence
Fluorescence and phosphorescence are forms of luminescence: spontaneous emission from an excited species that is not in thermal equilibrium with its environment. They are not distinguished reliably by color, by whether the sample is solid or liquid, or by one universal time threshold. The decisive questions are which state emits, how it was populated, whether the radiative transition changes spin multiplicity, and which competing pathways control the observed signal.
A spectrum identifies emission energies and relative strengths; a lifetime measures population kinetics; a quantum yield counts emitted photons per absorbed photon. Combining them constrains competing pathways more strongly than any one measurement.
Required background. Electronic spectroscopy explains vibronic preparation and Franck–Condon overlaps; Einstein coefficients defines radiative rates and their degeneracy conventions.
Fluorescence, phosphorescence, and delayed light
Section titled “Fluorescence, phosphorescence, and delayed light”IUPAC defines luminescence as spontaneous emission from an electronically or vibrationally excited species outside thermal equilibrium. Photoluminescence specifies that light created the excitation; chemiluminescence, electroluminescence, and other preparations need not begin with photon absorption.
Fluorescence
Section titled “Fluorescence”The IUPAC phenomenological definition of fluorescence is luminescence that occurs essentially only during irradiation. In molecular photophysics, the mechanistic use is usually more specific: fluorescence is radiative decay between states of the same spin multiplicity, most commonly
Because the leading electric-dipole operator does not act on spin, this channel can be spin allowed. Organic-molecule fluorescence lifetimes often fall in the picosecond-to-nanosecond range, but that empirical range is not the definition.
Phosphorescence
Section titled “Phosphorescence”In mechanistic photochemistry, phosphorescence is luminescence involving a change in spin multiplicity, most commonly
The leading spin-free electric-dipole matrix element vanishes between pure triplet and singlet states. Spin–orbit and other mixing mechanisms can make the transition weakly allowed. The resulting radiative rate is often small, so microsecond, millisecond, or longer emission can occur. Yet lifetime alone does not prove phosphorescence. With strong spin–orbit mixing, singlet and triplet are approximate character labels rather than exact quantum numbers; classify the state composition and transition mechanism instead of imposing a sharp spin label.
Prompt, delayed, and persistent signals
Section titled “Prompt, delayed, and persistent signals”| Observation | Mechanistic interpretation |
|---|---|
| Prompt fluorescence | Emission from the initially populated or rapidly equilibrated same-multiplicity state |
| Phosphorescence | Emission that changes multiplicity, often |
| Delayed fluorescence | Singlet fluorescence after the singlet state is repopulated at a later time |
| Trap or recombination emission | Delayed light controlled by charge release, transport, or recombination |
| Persistent luminescence | Phenomenological long afterglow; mechanism must be established |
The spectrum of delayed fluorescence can match prompt fluorescence because both are emitted from the same singlet state. Conversely, a phosphorescence spectrum can be spectrally distinct even if its lifetime overlaps another slow process.
Reading a Jablonski Diagram
Section titled “Reading a Jablonski Diagram”A Jablonski diagram groups electronic states by multiplicity, places them vertically by schematic energy, and uses arrows to indicate radiative and radiationless processes. It is a state-network map, not a trajectory on a potential-energy surface.
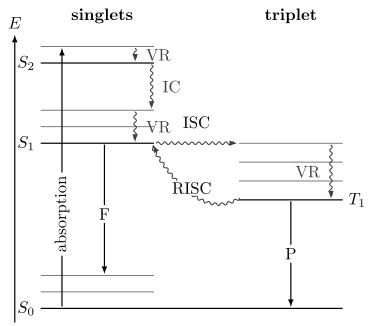
A schematic photophysical network. Straight arrows denote radiative processes (F: fluorescence, P: phosphorescence); wavy arrows denote radiationless transfer or relaxation, with nuclear and bath energy implicit. The uphill RISC branch requires energy supplied by those degrees of freedom. IC is internal conversion, ISC is intersystem crossing, RISC is reverse intersystem crossing, and VR is vibrational relaxation. Relative distances, arrow lengths, and arrow order are not time scales or branching probabilities.
What the horizontal lines mean
Section titled “What the horizontal lines mean”Each bold horizontal line denotes an electronic state such as , , or . Nearby thinner lines represent vibrational sublevels. The vertical spacing is only qualitative unless numerical energies are supplied.
The drawing omits nuclear coordinates, rotational/spin substructure, environmental modes, and coherent phases. Its radiationless arrows include energy redistribution into those omitted degrees of freedom.
A crossed arrow in a diagram does not calculate a rate. It asserts that a channel is being retained in the model.
What the arrows mean
Section titled “What the arrows mean”Typical arrow labels are:
| Symbol | Process | Photon? | Multiplicity |
|---|---|---|---|
| Absorption | Excitation by incident light | absorbed | often unchanged for E1 |
| Fluorescence | Radiative decay | emitted | unchanged |
| Phosphorescence | Radiative decay | emitted | changed |
| VR | Vibrational relaxation within an electronic state | none | unchanged |
| IC | Internal conversion between electronic states | none | unchanged |
| ISC | Intersystem crossing | none | changed |
| RISC | Reverse intersystem crossing | none | changed |
IUPAC defines a radiationless transition as a transition between states without photon absorption or emission. Radiationless does not mean energy disappears. Energy can enter nuclear motion, phonons, solvent modes, electronic excitations of another species, translation, or chemical products.
What the diagram does not mean
Section titled “What the diagram does not mean”It does not imply that:
- absorption always reaches ;
- every molecule relaxes to before anything else happens;
- always lies below ;
- IC and ISC are single deterministic jumps;
- phosphorescence must be visible;
- one arrow corresponds to one exponential component;
- higher excited-state emission is impossible.
The Kasha rule is a common empirical tendency, not a diagrammatic law.
Relaxation After Excitation
Section titled “Relaxation After Excitation”Franck–Condon preparation
Section titled “Franck–Condon preparation”For a phase-coherent pulse short compared with the relevant vibrational periods, the Condon approximation prepares an excited nuclear wavepacket proportional to the initial nuclear wavefunction. A long narrowband pulse can instead select one resolved stationary vibronic level. Franck–Condon overlaps determine transition strengths in both cases; pulse bandwidth and spectral phase determine whether several levels are populated coherently. Electronic Spectroscopy derives this preparation distinction and separates the vertical gap from a band maximum.
Immediately after the pulse, the excited ensemble may contain:
- vibrational excess energy;
- coherent superpositions of vibronic states;
- several electronic states within the pulse bandwidth;
- orientational selection by the light polarization;
- several conformers, sites, or species;
- solvent configurations inherited from the ground state.
Relaxation begins from that prepared distribution, not from a generic equilibrated state.
Vibrational relaxation
Section titled “Vibrational relaxation”Vibrational relaxation redistributes energy within one electronic state and often transfers energy to a bath:
In an isolated molecule, intramolecular vibrational redistribution can spread energy among modes without removing it from the molecule. In solution or a solid, collisions, solvent modes, and phonons can carry it away.
Vibrational cooling can shift and reshape a time-resolved fluorescence spectrum even while the electronic population remains in .
Internal conversion
Section titled “Internal conversion”IUPAC defines internal conversion as an isoenergetic radiationless transition between electronic states of the same multiplicity. A typical example is
where the asterisk indicates vibrational excitation in the receiving state. Subsequent vibrational relaxation can yield a cooled population.
Microscopically, internal conversion depends on vibronic coupling, energy gaps, accessible nuclear configurations, and the density of receiving states. Nonadiabatic Coupling derives that surface-dynamics description.
Intersystem crossing
Section titled “Intersystem crossing”IUPAC defines intersystem crossing as an isoenergetic radiationless transition between electronic states of different multiplicity. A common channel is
followed by triplet vibrational relaxation and internal conversion to . A spin-dependent interaction is needed to connect pure singlet and triplet states. Spin–orbit coupling is commonly dominant; hyperfine and other spin couplings can matter in suitable systems.
Solvent and structural relaxation
Section titled “Solvent and structural relaxation”The environment can reorganize around a changed excited-state charge distribution. Torsion, proton transfer, charge transfer, excimer formation, and conformational change can create a new emitting state. A time-dependent red shift or changing spectral shape can therefore report nuclear or solvent dynamics, not merely population loss.
Photochemistry and dissociation
Section titled “Photochemistry and dissociation”An excited state may react, isomerize, ionize, transfer an electron, or dissociate. Such channels can lower luminescence yield without producing a simple heat-only loss. A complete branching model should name photochemical products separately from unresolved nonradiative decay whenever they are measured.
Fluorescence
Section titled “Fluorescence”Transition amplitude
Section titled “Transition amplitude”For an emitting state and lower state , the leading electric-dipole amplitude is
In free space, the spontaneous E1 rate scales schematically as
with constants and angular factors determined by conventions and environment. Einstein Coefficients gives the exact free-space relation and degeneracy bookkeeping.
The radiative rate is not solely an intrinsic molecular number. Refractive index, interfaces, cavities, photonic density of states, orientation, and nearby absorbers can modify emission. A molecule’s internal transition moment and its electromagnetic environment are separate parts of the forward model.
Why fluorescence is often prompt
Section titled “Why fluorescence is often prompt”For a singlet ground state and singlet excited state, the spin overlap does not suppress the E1 transition. If the electronic and vibronic transition moments are substantial, can compete effectively with internal conversion and intersystem crossing.
Prompt does not mean instantaneous. The observed fluorescence appears after state preparation and evolves with the emitting-state population, instrument response, and any spectral relaxation.
Fluorescence spectrum
Section titled “Fluorescence spectrum”After cooling within , emission commonly samples
Franck–Condon factors distribute intensity among ground-state vibrational levels. The band often lies at lower photon energy than absorption because the excited ensemble relaxed before emission. The Electronic Spectroscopy page explains the 0–0 origin, Stokes shift, mirror-image approximation, and spectral-coordinate Jacobian.
Fluorescence polarization
Section titled “Fluorescence polarization”Linearly polarized excitation preferentially selects absorbers whose absorption transition dipoles project onto the electric field. Emission can remain polarized until rotational diffusion, energy transfer, state mixing, or structural relaxation erases orientational memory.
A common steady-state anisotropy definition is
after polarization-dependent instrument corrections. Here the subscripts refer to emission analyzed parallel and perpendicular to the excitation polarization.
Anisotropy decay is not the same as population decay. It can reveal rotation or energy migration while the total fluorescence intensity follows another time law.
Phosphorescence
Section titled “Phosphorescence”Spin-forbidden does not mean impossible
Section titled “Spin-forbidden does not mean impossible”For pure spin states and a spin-independent dipole operator,
Spin–orbit coupling mixes singlet and triplet basis states. Write
Then
The phosphorescence intensity borrowed through this path scales as when it is the only leading contribution. The same mixing can also enhance intersystem crossing into the triplet manifold.
The heavy-atom effect
Section titled “The heavy-atom effect”The IUPAC heavy-atom effect is enhancement of a spin-forbidden process through stronger spin–orbit coupling from an internal or external high- atom. It can increase ISC, phosphorescence rate, or both.
It does not guarantee brighter phosphorescence. Heavy atoms can also open nonradiative channels, alter electronic character, promote photochemistry, or increase quenching. Brightness depends on the entire rate network.
Why triplet emission is environment sensitive
Section titled “Why triplet emission is environment sensitive”A long triplet lifetime gives collisions and diffusion time to compete. Molecular oxygen is a particularly effective quencher for many triplet states. Rigid matrices, crystals, low temperature, and deoxygenation can suppress motion or collisions and make phosphorescence easier to observe.
These trends are diagnostic but not unique. Rigidity can also change electronic structure, aggregation, and phonon coupling. Oxygen can quench through energy or electron transfer and can generate reactive oxygen species.
Metastability is a rate statement
Section titled “Metastability is a rate statement”A metastable state has a small total escape rate under stated conditions. Its observed lifetime can be long because:
- the radiative transition is spin or symmetry suppressed;
- accepting vibrational or phonon states are unfavorable;
- the environment is rigid or cold;
- quenchers are absent;
- population is trapped behind a kinetic barrier.
The term does not mean the state is absolutely stable.
Spin–Orbit and Vibronic Control of ISC
Section titled “Spin–Orbit and Vibronic Control of ISC”A schematic golden-rule expression for intersystem crossing is
The final states include vibrational and environmental degrees of freedom, so energy conservation does not require equal electronic origins. A large electronic spin–orbit element is insufficient without receiving vibronic states and nuclear access to the coupling region.
Orbital character as a propensity
Section titled “Orbital character as a propensity”Spin–orbit matrix elements often depend strongly on orbital character. Transitions between states with different orbital types can have larger couplings than transitions between otherwise similar states. Such El-Sayed-type statements are propensity rules, not exact selection rules. Configuration mixing, geometry, vibronic coupling, and heavy atoms can reverse a simple label-based expectation.
Reverse intersystem crossing
Section titled “Reverse intersystem crossing”Triplet population can return to a singlet manifold:
This reverse intersystem crossing, RISC, can be thermally activated when lies moderately above . If the repopulated fluoresces, the spectrum can resemble prompt fluorescence while the decay follows the slower triplet reservoir.
The energy difference
is important, but it does not determine RISC alone. Spin–orbit coupling, vibronic mediation, conformational dynamics, state density, and the environment also matter.
Minimal Rate Network
Section titled “Minimal Rate Network”Consider a pulsed experiment that prepares molecules in an emitting singlet state. Let
For independent first-order channels,
so
The singlet population lifetime is
The prompt fluorescence photon rate before propagation and detection is
Branching yields
Section titled “Branching yields”Under the same model, the probability that one prepared singlet exits through channel is
Therefore
If the listed channels are exhaustive,
These are probabilities per prepared singlet, assuming no return to that state. They equal yields per absorbed photon only when each absorbed photon prepares one such singlet. If preparation succeeds with probability , multiply by ; re-excitation, radiative cascades, or recycling require their own network.
Radiative and observed lifetimes
Section titled “Radiative and observed lifetimes”The fluorescence radiative lifetime for one emitting state is
The observed population lifetime includes every exit channel:
Hence
Equivalently,
The second relation yields only the sum of nonfluorescent rates. A lifetime and fluorescence yield alone cannot separate IC, ISC, transfer, reaction, and quenching.
IUPAC defines the radiative lifetime as the lifetime in the absence of radiationless transitions and discourages “natural lifetime” as an equivalent term.
Sequential singlet-to-triplet kinetics
Section titled “Sequential singlet-to-triplet kinetics”Let triplets be formed by ISC and decay with
The coupled equations are
For and ,
At , the continuous limit is , a rise followed by decay rather than a singularity.
The phosphorescence photon rate is
The integrated phosphorescence yield from the initially prepared singlet is
This factorization separates triplet formation from radiative branching out of the triplet. A weak phosphorescence yield can result from poor triplet formation, poor triplet radiative branching, or both.
Continuous weak excitation
Section titled “Continuous weak excitation”For a constant absorbed-excitation rate in the linear regime,
The steady population is
and the fluorescence generation rate is
At high excitation, ground-state depletion, excited-state absorption, annihilation, stimulated emission, heating, or photochemistry can invalidate this linear relation.
Quantum Yield
Section titled “Quantum Yield”IUPAC defines a quantum yield as the number of specified events per photon absorbed. For fluorescence,
The denominator is not the number of incident photons. Reflection, transmission, scattering, and parasitic absorption must be treated.
Event yield versus detected count
Section titled “Event yield versus detected count”The detected number can be written schematically as
where the efficiencies represent collection geometry, propagation and reabsorption, and detector response. They can depend on wavelength, polarization, position, and time.
A bright detector signal can coexist with a modest intrinsic yield if collection is excellent. A weak signal can coexist with a high yield if absorption or collection is poor.
Photon units, not raw radiant power
Section titled “Photon units, not raw radiant power”At wavelength , one photon carries energy
If a calibrated instrument reports spectral radiant power , the corresponding spectral photon rate is
Integrating uncorrected watts across wavelength does not count photons and can bias a quantum yield.
Relative and absolute measurements
Section titled “Relative and absolute measurements”A relative measurement compares integrated, response-corrected emission with a standard of known yield under matched conditions. A common dilute-solution form is
where is integrated photon-corrected emission, is absorbance at the excitation wavelength, and is refractive index. The refractive-index factor and geometry must match the calibration convention.
An integrating sphere can measure absorbed and emitted photon flux more directly, but it still requires spectral response calibration, blank subtraction, correction for reabsorption, and tests for sample change.
Quantum yield is not lifetime
Section titled “Quantum yield is not lifetime”Two emitters can share a lifetime but have different fluorescence yields if both radiative and nonradiative rates scale together. They can share a yield but have very different lifetimes if all rates differ by a common factor.
The pair is more informative than either alone because, within the simple model, it gives and the aggregate competing rate.
Lifetimes and Decay Laws
Section titled “Lifetimes and Decay Laws”Single-exponential population decay
Section titled “Single-exponential population decay”For a time-independent first-order escape rate,
If the emission spectrum and radiative rate are stationary,
The time and integrated area divided by initial intensity both equal . An ideal complete photon-arrival distribution has mean ; an estimated lifetime from finite data also carries sampling uncertainty and depends on the observation window.
When intensity does not track one population
Section titled “When intensity does not track one population”At a fixed detection wavelength,
Spectral relaxation, state conversion, energy transfer, multiple emitters, or time-dependent transition moments can produce rises, shifts, and nonexponential decays. One wavelength trace may not represent the total excited-state population.
Multiexponential decays
Section titled “Multiexponential decays”A common empirical model is
with amplitudes defined at the chosen time origin and detection channel.
Two averages answer different questions. The amplitude-weighted time is
whereas the mean photon arrival time is
For nonnegative components, the integrated photon fraction is , not its time-zero amplitude fraction. Coupled rise-and-decay kinetics can require negative exponential amplitudes. The total signal can remain nonnegative, but those signed terms are not separate photon populations; is undefined if . The moment formula for still describes the full nonnegative signal when its area is positive.
Multiexponential fits are not unique microscopic decompositions. Continuous lifetime distributions, diffusion, transfer, spectral relaxation, and heterogeneous environments can generate similar curves.
Lifetime, coherence, and linewidth
Section titled “Lifetime, coherence, and linewidth”For a transition with a stable lower state and independent Markovian population loss and pure dephasing, population time and optical coherence time obey
where is a pure-dephasing time. Lifetime alone predicts a linewidth only when additional dephasing and inhomogeneous broadening are negligible.
For an exponential field coherence with time , the Lorentzian full width at half maximum in ordinary frequency is
Line Shapes and Broadening derives the width conversions and non-Lorentzian limits.
Time-correlated single-photon counting
Section titled “Time-correlated single-photon counting”In a pulsed photon-counting experiment, the measured histogram is a convolution:
where is the instrument response function and is a background model.
Deconvolution by eye is unreliable. Fit the convolved forward model and report the IRF, repetition period, time bin, fit window, background, and residuals. Count rates that are too high can produce pile-up: early photons are preferentially recorded, biasing the decay shorter.
Frequency-domain lifetime measurement
Section titled “Frequency-domain lifetime measurement”For a single exponential driven by sinusoidally modulated excitation at angular frequency , the emission has phase lag
and modulation ratio
Disagreement between phase and modulation lifetimes signals multiexponential behavior, background, or instrumental error.
Quenching
Section titled “Quenching”IUPAC defines quenching as nonradiative deactivation by an environmental influence or intramolecular substituent. Its distinction between dynamic and static quenching is experimentally important.
Dynamic quenching
Section titled “Dynamic quenching”For collisional quenching by species with bimolecular rate constant ,
Thus
With ,
If the radiative rate and absorption are unchanged, fluorescence yield and integrated intensity obey the same Stern–Volmer relation:
with
Agreement between intensity and lifetime ratios supports a simple dynamic model. It does not prove one microscopic quenching mechanism.
Static quenching
Section titled “Static quenching”Static quenching suppresses formation of the observed excited state, for example through a nonfluorescent ground-state complex. The uncomplexed fluorophores can retain their original lifetime even while total intensity falls:
Absorption changes, concentration dependence, and lifetime–intensity disagreement help distinguish static from dynamic behavior.
Why Stern–Volmer plots curve
Section titled “Why Stern–Volmer plots curve”Curvature can arise from:
- simultaneous static and dynamic quenching;
- multiple emissive species or sites;
- inaccessible fluorophore fractions;
- diffusion and transient encounter effects;
- quencher absorption or inner-filter artifacts;
- energy transfer, electron transfer, or reaction;
- concentration-dependent aggregation;
- changing temperature, viscosity, or refractive index.
A straight line is a model result under restrictive conditions, not a universal law.
Oxygen and triplet states
Section titled “Oxygen and triplet states”Oxygen quenching is often strongest for long-lived triplets because encounter probability accumulates over time. Deoxygenation, controlled oxygen concentration, and time-resolved measurements can therefore diagnose triplet participation.
Oxygen dependence alone is not conclusive. Oxygen can alter singlet fluorescence, react with photoproducts, change charge-transfer pathways, and participate in sensitized singlet-oxygen formation.
Delayed Fluorescence and Other Afterglow
Section titled “Delayed Fluorescence and Other Afterglow”Long-lived emission is a timing observation. The emitting transition must be identified separately.
Thermally activated delayed fluorescence
Section titled “Thermally activated delayed fluorescence”In thermally activated delayed fluorescence, TADF, triplet population reaches by RISC and then emits through the ordinary singlet fluorescence transition:
The delayed spectrum can therefore resemble prompt fluorescence. Useful diagnostics include:
- delayed intensity that grows with temperature over an activated range;
- matching prompt and delayed spectral shapes after response correction;
- coupled prompt and delayed kinetics;
- oxygen sensitivity through the triplet reservoir;
- dependence on and molecular conformation.
A thermally activated trend does not by itself prove TADF; trap release and activated transport can mimic it.
Triplet–triplet annihilation
Section titled “Triplet–triplet annihilation”Two triplet excitations can interact, if their total energy permits formation of the receiving singlet:
after which the singlet can relax and fluoresce, commonly from . For triplet number density , define as the number of two-triplet encounter events per volume and time. Then
The factor two counts lost triplets; only a fraction of encounters may produce an emissive singlet. For continuous generation, TTA fluorescence is quadratic in pump rate when first-order triplet loss dominates, approaching linear scaling when annihilation dominates.
Delayed fluorescence from this mechanism can show excitation-power dependence, concentration dependence, diffusion sensitivity, and nonexponential kinetics. IUPAC notes that triplet–triplet annihilation is often, but not always, followed by delayed fluorescence.
Charge recombination and traps
Section titled “Charge recombination and traps”Photoinduced charge separation can store excitation in spatially separated carriers or traps. Release and recombination later can repopulate an emitting state. The observed decay may reflect a distribution of trap depths, transport distances, and recombination rates rather than one molecular lifetime.
Diagnostics include:
- electric-field and sample-thickness dependence;
- thermoluminescence or temperature-ramp structure;
- power-law or stretched decays;
- charging history and dark-storage time;
- sample morphology and defect concentration;
- spectral evolution as different sites empty.
Mechanism table
Section titled “Mechanism table”| Delayed signal | Emitting transition | Reservoir or bottleneck | Useful test |
|---|---|---|---|
| Phosphorescence | Usually | Slow spin-forbidden radiative decay | Spectrum, oxygen, spin–orbit perturbation |
| TADF | Triplet population plus RISC | Temperature and prompt/delayed spectral match | |
| TTA fluorescence | Usually after two triplets create a singlet | Triplet density and diffusion | Excitation-power scaling |
| Recombination luminescence | State populated by charge recombination | Carriers or trapped charge | Electric field, dose, and trap-release tests |
| Persistent defect emission | Material-dependent | Traps, defects, or metastable states | Thermoluminescence and defect controls |
The IUPAC delayed fluorescence entry distinguishes thermally activated, annihilation, and recombination routes.
Measuring the Network
Section titled “Measuring the Network”No single experiment determines every rate. A strong analysis combines orthogonal observables.
Steady-state emission
Section titled “Steady-state emission”A corrected emission spectrum gives the wavelength distribution of detected radiant or photon flux under a stated excitation. It constrains emitting states and vibronic structure but folds together preparation, yield, collection, reabsorption, and detector response.
Excitation spectrum
Section titled “Excitation spectrum”Scanning excitation while monitoring emission tests which absorbers feed the chosen emitting channel. Equality with absorbance requires constant quantum yield, optically thin behavior, stable sample, and proper photon-flux and detector correction.
Time-resolved emission
Section titled “Time-resolved emission”Prompt and delayed windows reveal population transfer, rise times, spectral relaxation, and long-lived reservoirs. A gated spectrum should report gate start, width, repetition period, and background treatment.
Absolute or relative quantum yield
Section titled “Absolute or relative quantum yield”Yield supplies an integrated branching probability. Combining it with a lifetime separates a radiative rate from the aggregate competing rate under the one-state first-order model.
Transient absorption and related probes
Section titled “Transient absorption and related probes”Transient absorption can detect dark singlet, triplet, charge-transfer, and product populations that do not emit strongly. Time-resolved infrared, Raman, EPR, photoelectron, and product analysis can add structural or spin specificity.
Perturbation matrix
Section titled “Perturbation matrix”| Perturbation | Fluorescence | Phosphorescence or triplet signal | Main inference |
|---|---|---|---|
| Oxygen concentration | may decrease | often strongly decreases | collisional quenching and triplet participation |
| Temperature | rates and spectrum can shift | can activate RISC or nonradiative decay | barriers and thermal equilibration |
| Viscosity or rigidity | can suppress motion-driven loss | can enhance triplet survival | structural relaxation and collisions |
| Heavy-atom substitution | may decrease or shift | ISC and phosphorescence may increase | spin–orbit involvement |
| Excitation power | linear at low power | TTA can become nonlinear | one- versus two-excitation mechanism |
| Magnetic field | usually weak effect | can alter spin mixing or radical pairs | spin-correlated pathways |
| Concentration | reabsorption, transfer, aggregation | annihilation and quenching | intermolecular processes |
Each perturbation changes more than one parameter. Use a matrix of controls, not one signature.
Exercises
Section titled “Exercises”Exercise 1: Singlet branching
Section titled “Exercise 1: Singlet branching”An emitting singlet state has
Assume these channels are exhaustive and first order. Find the observed lifetime, fluorescence yield, IC yield, ISC yield, and fluorescence radiative lifetime.
Solution
The total rate is
Therefore
The branching yields are
They sum to one. The fluorescence radiative lifetime is
It is longer than the observed lifetime because IC and ISC also remove singlet population.
Exercise 2: What yield and lifetime can identify
Section titled “Exercise 2: What yield and lifetime can identify”A fluorophore has and . An independent triplet measurement gives .
- Find , , and the aggregate nonfluorescent rate.
- Find .
- If the only remaining channel is IC, find .
- Which rates could not be separated without the independent triplet measurement?
Solution
The total singlet escape rate is
The fluorescence rate is
The aggregate competing rate is
The independent ISC yield gives
If IC is the only other channel,
Without the triplet yield, the measured and would determine only and the sum
They could not separate those channels.
Exercise 3: Sequential triplet formation
Section titled “Exercise 3: Sequential triplet formation”After a pulse, a singlet population decays with and forms triplets with . The triplet total rate is , of which is phosphorescent.
- Find .
- Find the conditional triplet phosphorescence yield.
- Find the overall phosphorescence yield per prepared singlet.
- Explain the two timescales expected in .
Solution
The triplet-formation yield is
Once a triplet exists, its phosphorescence branching probability is
Thus
The triplet population is
It rises on the singlet time scale
and decays on the triplet time scale
Because these scales are widely separated, an instrument with nanosecond resolution sees rapid triplet formation followed by millisecond phosphorescence decay.
Exercise 4: Dynamic versus static quenching
Section titled “Exercise 4: Dynamic versus static quenching”An unquenched fluorophore has . A quencher has and concentration .
- Predict for pure dynamic quenching.
- Find the quenched lifetime.
- Predict .
- What observation would instead suggest a dominant static component?
Solution
The Stern–Volmer constant is
Thus
The lifetime is
For ideal dynamic quenching,
If integrated intensity or yield decreased while the lifetime of the remaining fluorescent population stayed near , static quenching, an inner-filter artifact, or inhibited excited-state formation would be more plausible than pure dynamic quenching.
Exercise 5: Two lifetime averages
Section titled “Exercise 5: Two lifetime averages”A decay is fitted by
Find:
- the amplitude-weighted lifetime;
- the mean photon arrival time;
- the integrated photon fraction from the component.
Solution
The amplitudes sum to one, so
The mean photon arrival time is
The integrated areas are proportional to
Therefore the long component contributes
or about of the photons, even though its time-zero amplitude is only .
Exercise 6: Recycling through reverse intersystem crossing
Section titled “Exercise 6: Recycling through reverse intersystem crossing”An initially prepared singlet has rates , , and in common inverse-time units. The triplet has , , and in the same units. Find total fluorescence and phosphorescence probabilities, including arbitrarily many cycles. Compare prompt and delayed fluorescence.
Solution
The total exit rates are and . One visit to emits fluorescence with probability and reaches with probability . One visit to returns to with probability and emits phosphorescence with probability . A completed recycling loop has probability . Therefore
The first-visit, prompt fluorescence probability is ; the delayed contribution is . The remaining probability is nonradiative loss. The single-pass product underestimates phosphorescence because recycling provides further opportunities to enter the triplet. Integrated ISC event counts can exceed one per initial excitation, so they are no longer a first-exit branching probability.
Exercise 7: Diagnose delayed emission
Section titled “Exercise 7: Diagnose delayed emission”A material has prompt emission centered at and a delayed component with the same corrected spectral shape. The delayed intensity increases from to , is suppressed by oxygen, and has a quadratic low-fluence dependence that becomes closer to linear as excitation increases.
Which mechanisms are supported? Which additional measurements would distinguish TADF from triplet–triplet annihilation?
Solution
The matching spectrum indicates that prompt and delayed photons may be emitted from the same singlet state. This disfavors assigning the delayed component to a spectrally distinct phosphorescence transition, but does not exclude an overlapping spectrum.
Increasing delayed intensity with temperature supports an activated route such as RISC and therefore TADF. Oxygen suppression supports a triplet reservoir. A quadratic-to-linear crossover supports a bimolecular contribution such as triplet–triplet annihilation: the quadratic loss eventually controls the triplet density. The data may contain both mechanisms.
Useful tests are:
- delayed intensity and lifetime versus excitation fluence over several decades;
- temperature-dependent prompt and delayed amplitudes in the low-fluence limit;
- concentration and viscosity dependence;
- direct triplet transient absorption;
- magnetic-field effects where relevant;
- global fitting to coupled – kinetics including a quadratic triplet term;
- repetition-rate dependence to test triplet accumulation.
TADF can remain first order in the low-excitation regime, whereas TTA requires two triplets and becomes density dependent.
Exercise 8: Separate radiative and competing rates
Section titled “Exercise 8: Separate radiative and competing rates”Adding a heavy-atom substituent shortens a molecule’s measured emission lifetime from to and lowers its fluorescence yield from to . A delayed red emission also appears.
- Compute the original and substituted fluorescence rates.
- Compute the aggregate competing rates.
- Does the result prove that spin–orbit coupling increased?
- List measurements needed to identify the delayed band.
Solution
For the original molecule,
For the substituted molecule,
The substitution greatly increases aggregate nonfluorescent decay and also changes the fluorescence rate. This is consistent with a heavy-atom effect opening ISC, but the two measurements do not isolate ISC from internal conversion, reaction, transfer, or quenching.
To identify the delayed red band, measure:
- its time-resolved spectrum and lifetime;
- triplet yield by transient absorption or sensitization;
- oxygen dependence;
- temperature dependence;
- magnetic-field or spin-resonance response where feasible;
- absolute phosphorescence and fluorescence yields;
- excitation spectrum and power dependence;
- photoproduct and aggregation controls.
A delayed band with a different spectrum, strong oxygen sensitivity, and triplet-state correlation would support phosphorescence, but the assignment requires the combined evidence.
For a general multistate kinetic model, see Pauli rate equations. Quantum-jump trajectories connects individual emission events to conditioned quantum evolution.
References
Section titled “References”- J. B. Birks, Photophysics of Aromatic Molecules, Wiley-Interscience, 1970 — foundational rate, fluorescence, phosphorescence, and delayed fluorescence treatment.
- S. E. Braslavsky, “Glossary of Terms Used in Photochemistry, 3rd Edition,” Pure and Applied Chemistry 79, 293–465 (2007) — authoritative photochemical nomenclature and measurement definitions.
- M. A. El-Sayed, “Spin–Orbit Coupling and the Radiationless Processes in Nitrogen Heterocyclics,” Journal of Chemical Physics 38, 2834–2838 (1963), doi:10.1063/1.1733610 — orbital-character propensity for intersystem crossing.
- IUPAC, “fluorescence,” Compendium of Chemical Terminology, 5th ed. (2025), accessed 2026-10-14. — phenomenological fluorescence definition.
- IUPAC, “internal conversion,” Compendium of Chemical Terminology, 5th ed. (2025), accessed 2026-10-14. and “intersystem crossing” — radiationless same- and different-multiplicity transitions.
- IUPAC, “Jablonski diagram,” Compendium of Chemical Terminology, 5th ed. (2025), accessed 2026-10-14. — state-diagram conventions and arrow meanings.
- IUPAC, “phosphorescence,” Compendium of Chemical Terminology, 5th ed. (2025), accessed 2026-10-14. — phenomenological and spin-multiplicity definitions.
- IUPAC, “quantum yield,” Compendium of Chemical Terminology, 5th ed. (2025), accessed 2026-10-14. and “radiative lifetime” — event-count and lifetime conventions.
- IUPAC, “quenching,” Compendium of Chemical Terminology, 5th ed. (2025), accessed 2026-10-14. and “Stern–Volmer kinetic relationships” — dynamic and static quenching terminology and kinetics.
- M. Kasha, “Characterization of Electronic Transitions in Complex Molecules,” Discussions of the Faraday Society 9, 14–19 (1950), doi:10.1039/DF9500900014 — origin of the rule concerning emission from the lowest state of a multiplicity.
- J. R. Lakowicz, Principles of Fluorescence Spectroscopy, 3rd ed., Springer, 2006 — fluorescence spectra, anisotropy, lifetimes, yields, quenching, and instrumentation.
- N. J. Turro, V. Ramamurthy, and J. C. Scaiano, Modern Molecular Photochemistry of Organic Molecules, University Science Books, 2010 — singlet and triplet photochemistry, energy transfer, and reaction pathways.
- B. Valeur and M. N. Berberan-Santos, Molecular Fluorescence: Principles and Applications, 2nd ed., Wiley-VCH, 2012 — molecular photophysics from state preparation through time-resolved measurements.