

Rotational Spectroscopy
Rotational spectroscopy identifies transitions between quantized rotational states of molecules. The most familiar measurements lie in the microwave, millimeter-wave, and submillimeter-wave regions, although the defining feature is the molecular motion being probed rather than a fixed instrument band.
Measured line centers constrain effective rotational constants and moments of inertia. Converting those constants into bond lengths requires assignments, a Hamiltonian, isotope masses, and vibrational corrections. A transition frequency can therefore be known much more accurately than the structure inferred from it.
Required background. Rotational spectra derives the ideal line ladder; spectroscopic selection rules explains why the transition operator and molecular state determine which lines occur.
What a Rotational Spectrum Measures
Section titled “What a Rotational Spectrum Measures”Resonance condition
Section titled “Resonance condition”For an isolated transition from lower state to upper state , the field-free rest frequency is
An experiment does not generally report this number without qualification. The observed line center can contain pressure, Stark, Zeeman, recoil, instrumental, and kinematic shifts:
The same interactions can split one transition into several resolved components. A reported center is meaningful only with the pressure, external fields, line-shape model, reference clock, and unresolved structure stated. Line Shapes and Broadening develops that distinction.
Frequency, angular frequency, and wavenumber
Section titled “Frequency, angular frequency, and wavenumber”Three conventions are common:
| Spectral coordinate | Relation to an energy difference |
|---|---|
| Ordinary frequency | |
| Angular frequency | , with |
| Vacuum wavenumber |
Because the speed of light is exact in SI,
Microwave catalogs usually quote ordinary frequency, often in MHz, whereas infrared work commonly uses vacuum wavenumber in . The symbol inherits the unit convention. A factor of or is lost if a constant is moved between formulas without its units.
Absorption and emission name the same gap
Section titled “Absorption and emission name the same gap”The notation
labels an absorption transition by placing the upper state on the left. The reverse emission involves the same internal level gap. For an initially stationary free molecule, photon recoil shifts absorption above and emission below that internal frequency by approximately , where is the molecular mass; the common-frequency shorthand neglects this correction and Doppler motion. Thus a catalog entry can be used to identify either laboratory absorption or astronomical emission. The arrow records the process convention; it does not change the level separation.
Rotational Energy Levels
Section titled “Rotational Energy Levels”Linear rigid rotor
Section titled “Linear rigid rotor”For a closed-shell linear molecule in its lowest nondegenerate vibrational state, the simplest model is
where is either principal moment perpendicular to the molecular axis. Its states have
and, in zero external field,
This page uses in ordinary-frequency units unless another convention is displayed explicitly. The values of are degenerate in the scalar field-free model. Nuclear-spin statistics, hyperfine interactions, electronic angular momentum, and external fields can alter the observable level count.
Rotational constants are effective parameters
Section titled “Rotational constants are effective parameters”A real molecule vibrates, stretches under rotation, and can couple rotation to spin, nuclear spin, tunneling, or nearby vibrational states. For a semirigid linear molecule, define
A common effective expansion is
where in the usual low-order centrifugal-distortion model. The fitted constants describe the stated vibrational, electronic, and isotopic state over a limited range of . The truncated term cannot describe arbitrarily high rotation: eventually higher terms, state mixing, or dissociation matter. They are not universal constants of the chemical formula.
If labels the upper of an adjacent transition, then
The rigid lines occur at . Positive moves high- lines progressively below that arithmetic progression. Higher-order terms should be added because the data require them, not merely because a longer polynomial lowers a residual.
Level populations
Section titled “Level populations”For a thermal ensemble in the same electronic and vibrational state, a linear-rotor population has the schematic form
The nuclear-spin factor can alternate with or make some levels absent for molecules containing identical nuclei. Ignoring those weights, treating as continuous, and using the rigid energy gives
At very low temperature the continuous estimate can lie below zero; compare the physical integer levels instead. It estimates the most populated level, not necessarily the strongest line. An observed intensity also contains a rotational line-strength factor, stimulated-emission correction, transition dipole, abundance, propagation, line profile, and instrument response.
Permanent Dipole Requirement
Section titled “Permanent Dipole Requirement”Electric-dipole coupling
Section titled “Electric-dipole coupling”The leading interaction with a long-wavelength electric field is
For a pure rotational electric-dipole transition, the electronic and vibrational state is unchanged. The molecule must therefore possess a nonzero permanent dipole component in its body-fixed frame:
The laboratory dipole contains orientation operators whose off-diagonal rotational matrix elements can be nonzero. A stationary parity eigenstate can still have zero laboratory dipole expectation; it need not carry a classically rotating dipole vector. A coherent superposition of rotational levels can produce the time-dependent polarization measured in free-induction decay.
Rotational levels can exist without microwave E1 lines
Section titled “Rotational levels can exist without microwave E1 lines”A vanishing permanent dipole does not eliminate rotational quantization. It eliminates the leading pure rotational electric-dipole channel. Ideal homonuclear diatomics such as and have rotational levels but no ordinary E1 microwave ladder. Their rotation can instead be probed by mechanisms such as rotational Raman scattering, collision-induced absorption, electric-quadrupole transitions, or magnetic-dipole transitions when the molecular state permits them.
Conversely, being heteronuclear does not by itself guarantee a large dipole. Symmetry and electronic structure determine . Carbon monoxide has a weak but nonzero permanent dipole and a readily measurable rotational spectrum; a symmetric polyatomic molecule can have no permanent dipole even though it contains different elements.
Line absence is not a dipole measurement by itself
Section titled “Line absence is not a dipole measurement by itself”A missing line may also reflect low abundance, an unfavorable population, limited frequency coverage, optical depth, destructive baseline processing, or an incorrect assignment. Establishing requires a symmetry argument or a quantitative upper limit with the experimental sensitivity and excitation model included.
Linear-Rotor Rule ΔJ = ±1
Section titled “Linear-Rotor Rule ΔJ = ±1”Rank-one angular momentum
Section titled “Rank-one angular momentum”The electric dipole is a spherical tensor of rank . Angular-momentum addition therefore gives the general necessary condition
For a closed-shell linear molecule in the same nondegenerate vibronic state, the parity and body-axis conditions remove the pure rotational line. The leading rule becomes
The corresponding rigid-rotor absorption frequencies are
Selection Rules in Spectroscopy explains why every rule must be attached to an operator, symmetry limit, and state classification.
Magnetic sublevels and polarization
Section titled “Magnetic sublevels and polarization”With a laboratory quantization axis, the spherical polarization component imposes
In zero field the components are degenerate and may form one unresolved line. An electric or magnetic field can split or mix them. Polarization then provides assignment information, but the field-dressed eigenstates and laboratory conventions must replace the field-free shorthand.
Polyatomic molecules require more labels
Section titled “Polyatomic molecules require more labels”The formula is a reliable linear-rotor mnemonic, not a complete rule for every rotational spectrum. Symmetric tops carry a body-axis projection label . Asymmetric-top states are commonly labeled , where and connect to prolate and oblate limiting bases. A dipole component along a principal axis produces an -, -, or -type transition pattern.
For asymmetric tops, transitions between distinct states with the same can occur, so lines are possible when the full rank-one and axis-component rules are satisfied. Rotor class, state labels, and detailed rules are developed in Rotations of Molecules.
Open-shell notation
Section titled “Open-shell notation”In a closed-shell linear rotor, can denote the rotational angular momentum. In open-shell spectroscopy, catalogs often use for total angular momentum excluding electron spin and reserve for a coupled total such as
When electronic orbital angular momentum is present, includes it and is not simply the mechanical nuclear rotation. Spin–rotation, spin–spin, orbital, lambda-doubling, and hyperfine interactions can split a nominal rotational line. Quantum-number columns must be read from the catalog’s species documentation rather than inferred from one familiar closed-shell formula.
Rotational Constants and Line Patterns
Section titled “Rotational Constants and Line Patterns”Rotational constants in different units
Section titled “Rotational constants in different units”The same moment of inertia can be encoded as
Here has energy units, has frequency units, and has inverse-length units. A reported number such as “” is incomplete.
For a nonlinear molecule with ordered principal moments
the corresponding frequency constants satisfy
One linear-rotor constant determines one perpendicular moment. Three nonlinear-rotor constants determine three principal moments, but not generally every internal coordinate.
Reading a nearly regular comb
Section titled “Reading a nearly regular comb”For a semirigid linear rotor through quartic distortion,
Three visual tests are useful:
- candidate lines should lie near integer multiples of one base spacing;
- successive spacings should decrease smoothly when ; and
- relative intensities should be broadly compatible with one excitation temperature after line strengths and spin weights are included.
These are assignment clues, not proofs. Unrelated species, isotopologues, vibrational satellites, and instrumental artifacts can accidentally form short regular sequences.
The departure of adjacent spacings from is
The cubic growth makes high- lines especially sensitive to , but also more vulnerable to omitted higher-order terms and perturbations.
Worked fit from two lines
Section titled “Worked fit from two lines”Suppose the assigned and line centers are
Using
form a combination that cancels :
Then
Two exact-looking numbers do not validate the model. Additional transitions are needed to test residuals, estimate uncertainty, and decide whether , hyperfine terms, or perturbations are required.
Combination differences
Section titled “Combination differences”When several transitions share levels, differences between measured line frequencies can remove an unknown level or band origin. Such combinations are valuable because they test assignments before a global Hamiltonian fit. A closed network should reproduce the same term-value difference along independent paths within uncertainty. Failure points to a misassignment, blending, calibration problem, or inadequate state model.
How Rotational Spectra Are Recorded
Section titled “How Rotational Spectra Are Recorded”Direct absorption
Section titled “Direct absorption”A frequency-swept microwave, millimeter-wave, or submillimeter-wave source is passed through a gas cell or molecular beam. The experiment records attenuation or a heterodyne response as the source crosses resonance. Frequency multipliers extend coherent sources to higher bands. Long path lengths, modulation, and phase-sensitive detection improve sensitivity.
Direct absorption can cover warm samples and high rotational levels, but pressure broadening, standing waves, source power variation, and unresolved velocity structure must be controlled.
Fourier-transform microwave spectroscopy
Section titled “Fourier-transform microwave spectroscopy”A short resonant pulse creates rotational coherence. After the pulse, the macroscopic polarization emits a free-induction decay,
whose Fourier transform reveals the transition frequencies. A resonant cavity offers high sensitivity and resolution over a narrower band. Chirped-pulse instruments excite and detect a broad band at once.
Supersonic expansions often cool rotational populations and simplify spectra, while also changing conformer populations and cluster formation. Raw peak heights are not automatically equilibrium line strengths because the pulse spectrum, coherence dynamics, cavity response, and detection chain weight them.
Astronomical rotational spectra
Section titled “Astronomical rotational spectra”Molecules in interstellar, circumstellar, and planetary environments emit or absorb rotational radiation. The observed frequency is shifted by source motion and cosmological redshift where relevant. For nonrelativistic radial motion,
under the convention that means recession.
Identification requires more than one coincident line whenever possible. The candidate should predict additional transitions with consistent velocities, excitation, widths, spatial distributions, and absence of severe blends. Translating brightness into abundance then requires radiative transfer and, often, non-LTE collisional data. A line catalog supplies rest frequencies and intensities; it does not by itself establish a molecular detection.
What controls resolution
Section titled “What controls resolution”The narrowest useful line is set by both the sample and the measurement. Relevant scales include Doppler width, collision rates, transit time, finite acquisition time, unresolved hyperfine structure, source linewidth, and frequency-reference accuracy. A longer time record narrows the Fourier bin, but it cannot undo physical dephasing or an unmodeled systematic shift.
Isotope Effects
Section titled “Isotope Effects”Reduced-mass scaling for a diatomic
Section titled “Reduced-mass scaling for a diatomic”For a diatomic molecule with internuclear distance ,
In the rigid Born–Oppenheimer limit, isotope substitution changes the masses but leaves the equilibrium potential and unchanged. Therefore
A heavier isotopologue usually has a larger moment of inertia, a smaller rotational constant, and lines shifted to lower frequency.
Carbon monoxide example
Section titled “Carbon monoxide example”The JPL molecular line catalog lists the first four ground-state transitions of and at the frequencies shown below.
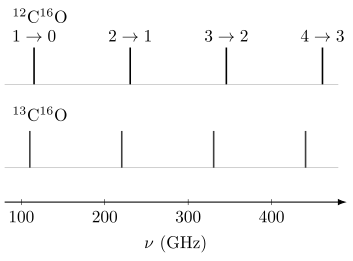
Cataloged rest frequencies for through ; equal stick heights do not represent intensities. Replacing by increases the reduced mass and shifts the entire ladder downward. The slight departure from a perfectly scaled, equally spaced comb contains centrifugal-distortion and isotope-dependent effective-structure information. Frequencies are from the JPL Submillimeter, Millimeter, and Microwave Spectral Line Catalog entries 28001 and 29001.
For the lines,
Their observed ratio is
Using isotope mass numbers for a quick rigid estimate gives
and hence
Agreement at roughly is already strong evidence for a common geometry and the expected mass scaling. The residual is meaningful: the frequency is not exactly , integer mass numbers are not exact isotopic masses, and contains isotope-dependent zero-point averaging and small non-Born–Oppenheimer corrections.
Isotopic substitution is an assignment test
Section titled “Isotopic substitution is an assignment test”An isotope pattern contributes several mutually reinforcing checks:
- the frequency shift should have the sign and approximate magnitude predicted from inertia;
- the full set of lines should fit one isotopologue Hamiltonian;
- isotopic abundance should be broadly compatible with signal strength after excitation and dipole factors are included; and
- hyperfine changes should follow the substituted nuclear spin and moments.
One matching line is weak evidence. A coherent mass-scaled ladder is much stronger.
Beyond the diatomic scaling law
Section titled “Beyond the diatomic scaling law”For a polyatomic molecule, isotope substitution changes all three principal moments according to the substituted atom’s coordinates relative to the center of mass. The shifts in , , and are therefore directional. They can help locate the atom in the principal-axis frame, but the axes and center of mass themselves move after substitution. Standard substitution structure formulas account for this geometry; simply attaching to a polyatomic rotor is not valid.
Molecular Structure Determination
Section titled “Molecular Structure Determination”Direct result for a diatomic
Section titled “Direct result for a diatomic”If is in ordinary-frequency units, the rigid diatomic relation can be inverted:
Approximating and using integer isotope masses in the CO example gives
from either isotopologue. The agreement is the important result; the subscript “app” is equally important. This quick value is based on a ground-state effective constant, not directly on an equilibrium geometry.
Which bond length?
Section titled “Which bond length?”Several structural quantities occur in rotational spectroscopy:
| Symbol | Meaning |
|---|---|
| Equilibrium distance at the minimum of the Born–Oppenheimer potential | |
| Effective ground-vibrational-state structure fitted from ground-state constants | |
| Substitution structure inferred from isotopic moment changes | |
| Mass-dependent fitted structure using several isotopologues | |
| Semi-experimental equilibrium structure after calculated vibrational corrections |
These definitions are not interchangeable. A measured reflects a vibrational average of inverse inertia. Even with negligible statistical frequency uncertainty, identifying with leaves a systematic zero-point error.
The polyatomic inverse problem
Section titled “The polyatomic inverse problem”For nuclei at center-of-mass coordinates , the inertia tensor is
Diagonalizing it gives , and hence . A nonlinear -atom molecule has internal geometric degrees of freedom, while one isotopologue supplies only three principal moments. Except for very small or strongly constrained molecules, one spectrum cannot determine a unique geometry.
Additional information may come from:
- rotational constants of many singly substituted isotopologues;
- symmetry constraints and known connectivity;
- vibration–rotation corrections from electronic-structure calculations;
- isotopic changes in centrifugal-distortion and hyperfine constants;
- dipole-component information from -, -, and -type intensities;
- independent diffraction, infrared, Raman, or electronic-structure data.
The final geometry should report which data and constraints entered, which parameters were fixed, and how statistical and model uncertainties were propagated.
What dipole components reveal
Section titled “What dipole components reveal”For an asymmetric top, the appearance of -, -, or -type transitions shows which principal-axis components of the permanent dipole are nonzero. Calibrated relative intensities can constrain , , and when the populations, line strengths, and instrument response are modeled.
Ordinary field-free intensities do not generally determine the signs of those components. Nor do rotational constants distinguish enantiomers: mirror-image molecules have the same masses and principal moments in an achiral environment. Conformers and constitutional isomers, by contrast, usually have different inertia tensors and can often be separated cleanly.
Precision, accuracy, and identifiability
Section titled “Precision, accuracy, and identifiability”Three questions should be asked separately:
- Precision: how reproducibly is each line center measured?
- Model adequacy: does the effective Hamiltonian predict withheld lines within their uncertainties without structured residuals?
- Structural identifiability: do the fitted moments and auxiliary data determine the claimed geometry uniquely enough for the stated error bar?
A fit can answer the first question impressively while failing the second or third. More digits in , , and do not create missing geometric information.
Line Intensities and Temperature
Section titled “Line Intensities and Temperature”Integrated intensity is the stable object
Section titled “Integrated intensity is the stable object”Peak height changes with broadening even when the number of absorbers and the transition strength do not. For quantitative work, use an integrated absorption coefficient or calibrated emitted intensity with a declared line profile and radiative-transfer model. Absorption and Emission sets out those conventions.
In optically thin LTE absorption, the absorption coefficient integrated over ordinary frequency has the dependence
where is the total lower-level number density and is a dimensionless rotational factor averaged over its magnetic substates and summed over the specified final/polarization channels. The factor is essential when comparing lines at different frequencies. Do not add a second lower-level degeneracy factor to . The bracket accounts for stimulated emission. Catalog intensities may fold in partition functions, abundance conventions, and a reference temperature; their documentation is part of the data.
Population diagrams need assumptions
Section titled “Population diagrams need assumptions”Under optically thin LTE conditions, integrated emission from several transitions can be organized into a rotational diagram. A straight-line form is obtained only after correcting for degeneracy, Einstein coefficients, frequency factors, and beam filling. Curvature can indicate multiple temperatures, optical depth, non-LTE excitation, blends, or inaccurate partition functions. It is not automatically evidence for a new molecular state.
Using Spectral Catalogs
Section titled “Using Spectral Catalogs”Catalog entries are evaluated model outputs
Section titled “Catalog entries are evaluated model outputs”The JPL and Cologne databases combine laboratory measurements, effective Hamiltonian fits, and predicted transitions. A typical entry can include frequency, estimated uncertainty, line intensity, lower-state energy, degeneracy, species tag, coding format, and upper and lower quantum numbers. The frequency may be measured directly or predicted from a global fit.
Before using an entry, check:
- the isotopologue, electronic state, vibrational state, and conformer;
- the quantum-number coding and parity convention;
- whether the frequency is measured, fitted, or extrapolated;
- the stated one-standard-deviation uncertainty and its model basis;
- the intensity convention and reference temperature;
- the partition function and nuclear-spin convention; and
- the entry documentation date and cited laboratory data.
An old evaluated entry can remain excellent within its measured range. It should not be treated as current merely because the web interface has a recent date, nor should a low formal uncertainty be trusted far beyond the data that constrain the Hamiltonian.
Database roles
Section titled “Database roles”- The JPL Molecular Spectroscopy catalog distributes machine-readable microwave, millimeter-wave, and submillimeter-wave line lists with species-specific documentation.
- The Cologne Database for Molecular Spectroscopy provides evaluated molecular entries and access through astronomical data services.
- The NIST Triatomic Spectral Database explicitly separates observed and predicted frequencies for many triatomics and records uncertainties and literature sources. Its data content was last updated in 2003, so its value is evaluated provenance, not universal recency.
For high-consequence identification or precision work, follow the catalog documentation back to the primary measurements and fitting model.
Exercises
Section titled “Exercises”Exercise 1: Convert rotational constants
Section titled “Exercise 1: Convert rotational constants”A linear molecule has . Find its frequency constant in GHz and the rigid transition frequency.
Solution
Using ,
The rigid line is at
The ordinary frequency, not angular frequency, was used throughout.
Exercise 2: A combination that tests the quartic fit
Section titled “Exercise 2: A combination that tests the quartic fit”Using , find the combination . If its measured value is and each independent line center has standard uncertainty , estimate and its statistical uncertainty. What physical conclusion still needs checking?
Solution
The and contributions cancel. The contribution is , so
The combination is inconsistent with a quartic model at the stated independent uncertainties. It does not uniquely prove sextic distortion: blending, correlated calibration errors, state mixing, or misassignment could also cause it. Additional transitions should test the predicted dependence.
Exercise 3: A body-fixed dipole without a stationary laboratory dipole
Section titled “Exercise 3: A body-fixed dipole without a stationary laboratory dipole”A polar linear rotor has . Use and to compare and .
Solution
The diagonal integral is zero because is odd under inversion. The transition integral uses :
Thus a stationary state has no preferred laboratory orientation but can absorb polarized radiation into . A nonzero body-fixed dipole does not imply a nonzero laboratory expectation in every state.
Exercise 4: Precision does not remove vibrational averaging
Section titled “Exercise 4: Precision does not remove vibrational averaging”Suppose a diatomic has . If is inserted into the rigid equilibrium bond-length formula, what fractional bond-length error results? Does reducing the statistical uncertainty in to one part in a billion remove that error?
Solution
At fixed reduced mass, , so . The apparent distance is about too large. Frequency precision does not correct the distinction between a vibrationally averaged and an equilibrium constant; an explicit vibration–rotation model is needed.
Exercise 5: Most populated level
Section titled “Exercise 5: Most populated level”A linear rotor has and is in thermal equilibrium at . Ignoring nuclear-spin weights, estimate the most populated . Use . Why does this not by itself locate the strongest absorption line?
Solution
The continuous estimate gives
The most populated integer level is therefore expected near ; exact discrete populations should be compared around that value.
The strongest absorption line also depends on the line-strength factor, the stimulated-emission correction, frequency dependence, broadening, abundance, optical depth, and instrument response. The population maximum is only one input.
Exercise 6: Structural identifiability
Section titled “Exercise 6: Structural identifiability”One isotopologue of a nonlinear six-atom molecule has accurately fitted . Explain why these constants do not uniquely determine all equilibrium bond lengths and angles.
Solution
A nonlinear six-atom molecule has
internal geometric degrees of freedom. The three rotational constants supply three principal moments of inertia, so the inverse problem is underdetermined. In addition, the subscript denotes ground-state vibrational averaging rather than equilibrium moments.
Multiple isotopologues, symmetry and connectivity constraints, and computed vibration–rotation corrections are typical additional inputs. Their assumptions must be included in any structural uncertainty.
Exercise 7: Catalog coincidence and Doppler velocity
Section titled “Exercise 7: Catalog coincidence and Doppler velocity”An astronomical feature appears at near a catalog rest frequency of . Using the nonrelativistic radio sign convention, estimate the recession velocity. Why is this one match not enough for a molecular identification?
Solution
With for recession,
Therefore
Dense line surveys contain accidental frequency coincidences. A credible identification should reproduce several transitions at the same velocity with compatible excitation, width, spatial distribution, isotope behavior, and predicted non-detections.
Exercise 8: Extrapolation test
Section titled “Exercise 8: Extrapolation test”A fit to low- lines has a small residual using only and . At high , all observed lines lie progressively above the predictions. Give two possible explanations and one test that distinguishes a random measurement error from model inadequacy.
Solution
Possible physical explanations include a missing sextic distortion term , interaction with a nearby state, or a high- assignment error. A frequency-calibration error that changes with band is another systematic possibility.
Random independent errors should fluctuate in sign. A smooth, quantum-number dependent sequence of signed residuals is evidence of model inadequacy or a correlated calibration problem. Fit and withhold interleaved high- lines, inspect residuals versus and frequency band, and test whether one physically motivated extra term predicts the withheld data. Merely reducing the residual on the fitted points is insufficient.
Spectroscopy nomenclature explains branch strings and quantum labels; rotations of molecules derives the rotor Hamiltonians used in these fits, and rovibrational coupling treats vibration-dependent constants.
References
Section titled “References”- P. F. Bernath, Spectra of Atoms and Molecules, 5th ed., Oxford University Press, 2025, doi:10.1093/oso/9780197754498.001.0001.
- J. M. Brown and A. Carrington, Rotational Spectroscopy of Diatomic Molecules, Cambridge University Press, 2003, doi:10.1017/CBO9780511814808.
- C. C. Costain, “Determination of Molecular Structures from Ground State Rotational Constants,” Journal of Chemical Physics 29, 864–874 (1958), doi:10.1063/1.1744602.
- C. P. Endres, S. Schlemmer, P. Schilke, J. Stutzki, and H. S. P. Müller, “The Cologne Database for Molecular Spectroscopy, CDMS, in the Virtual Atomic and Molecular Data Centre, VAMDC,” Journal of Molecular Spectroscopy 327, 95–104 (2016), doi:10.1016/j.jms.2016.03.005.
- W. Gordy and R. L. Cook, Microwave Molecular Spectra, 3rd ed., Wiley, 1984.
- International Union of Pure and Applied Chemistry, “rotational constant”, Compendium of Chemical Terminology, 5th ed., online version 5.0.0, 2025.
- JPL Molecular Spectroscopy, catalog entry 28001 and catalog entry 29001, accessed 2026-10-14.
- J. Kraitchman, “Determination of Molecular Structure from Microwave Spectroscopic Data,” American Journal of Physics 21, 17–24 (1953), doi:10.1119/1.1933338.
- H. S. P. Müller, S. Thorwirth, D. A. Roth, and G. Winnewisser, “The Cologne Database for Molecular Spectroscopy, CDMS,” Astronomy & Astrophysics 370, L49–L52 (2001), doi:10.1051/0004-6361:20010367.
- NIST Physical Measurement Laboratory, Triatomic Spectral Database, Standard Reference Database 117, data content updated July 2003, doi:10.18434/T4DW2S, accessed 2026-10-14.
- H. M. Pickett, “The Fitting and Prediction of Vibration-Rotation Spectra with Spin Interactions,” Journal of Molecular Spectroscopy 148, 371–377 (1991), doi:10.1016/0022-2852(91)90293-O.
- H. M. Pickett, R. L. Poynter, E. A. Cohen, M. L. Delitsky, J. C. Pearson, and H. S. P. Müller, “Submillimeter, Millimeter, and Microwave Spectral Line Catalog,” Journal of Quantitative Spectroscopy and Radiative Transfer 60, 883–890 (1998), doi:10.1016/S0022-4073(98)00091-0.
- C. H. Townes and A. L. Schawlow, Microwave Spectroscopy, McGraw–Hill, 1955; Dover reprint, 1975.