

Ultrafast Spectroscopy Overview
Ultrafast spectroscopy uses controlled short pulses and phase-sensitive detection to infer how quantum systems evolve on femtosecond and attosecond timescales. A first interaction prepares a non-equilibrium state. The system evolves for a controlled delay. A later interaction converts some feature of that state into an observable such as transmitted light, fluorescence, photoelectrons, ions, X-rays, or diffracted particles.
The delay coordinate is experimentally precise, but it is not automatically a direct movie time. Each data point is an ensemble measurement filtered by the pump, probe, detector, sample response, and data processing. Calling a delay trace a “molecular movie” is justified only after the mapping from quantum dynamics to signal has been established.
Required background. Spectroscopy explains how preparation and detection shape spectra; the Fourier transform relates pulse duration, bandwidth, and spectral phase. For recent research questions, see attosecond and ultrafast frontiers.
What Time-Resolved Spectroscopy Measures
Section titled “What Time-Resolved Spectroscopy Measures”Repeated preparation, not one evolving specimen
Section titled “Repeated preparation, not one evolving specimen”Most pump–probe experiments repeat a cycle:
- prepare a nominally identical sample or allow it to return to its initial state;
- apply a pump pulse;
- wait for a controlled delay ;
- apply a probe pulse;
- record one or more detector channels;
- change and repeat.
The assembled trace is stroboscopic. Its interpretation assumes that the initial ensemble, pulse sequence, and environment are reproducible. At high repetition rate, incomplete recovery, sample heating, photochemistry, charge accumulation, or flow can violate that assumption.
For separated pulses and a fixed linear probe-and-detection map, an idealized signal is
where is the state just before the probe and is a probe-and-detection window operator. Two probes with different photon energies, polarizations, ionization channels, or collection geometries generally have different and therefore record different traces from the same underlying state. More formally, a probe map and detector effect give . The map can include evolution during a finite probe. Overlapping pulses, changing probe conditions, or nonlinear sample feedback need a fuller response model.
A method family
Section titled “A method family”| Method | Recorded observable | Typical inference | Important caveat |
|---|---|---|---|
| Transient absorption | Pump-induced transmission or absorbance change versus probe energy and delay | Populations, stimulated emission, excited-state absorption, spectral shifts | Several pathways overlap with signs and phases |
| Time-resolved fluorescence | Photon counts, spectrum, polarization, or arrival time | Emissive-state population and relaxation | Dark states and nonradiative pathways can be invisible |
| Time-resolved photoelectron spectroscopy | Electron energy, angle, spin, or coincidence channel | Ionization-accessible electronic and nuclear dynamics | Ionization matrix elements and ionic final states gate the signal |
| Time-resolved Raman spectroscopy | Raman shift and intensity versus delay | Vibrational structure and evolving local environment | Resonance enhancement and pulse overlap can reshape intensity |
| Two-dimensional spectroscopy | Correlation between excitation and detection frequencies | Couplings, inhomogeneity, transfer, and coherence pathways | Phase stability and pathway separation are essential |
| Ultrafast diffraction | Momentum-resolved electron or X-ray scattering | Pair distributions and structural change | Inversion to geometry is incomplete and model dependent |
“Ultrafast” names the temporal scale, not a single interaction or detector. The observable must be stated before a decay or oscillation is assigned.
Ultrashort Pulses
Section titled “Ultrashort Pulses”Envelope, carrier, and spectrum
Section titled “Envelope, carrier, and spectrum”A real electric field can be represented by a positive-frequency component,
plus its complex conjugate. The carrier frequency is and the complex envelope contains the pulse amplitude and phase. A Fourier convention is
The spectral intensity is proportional to , but intensity alone does not specify the time-domain pulse. Write
The spectral phase may be expanded near :
contains a carrier phase, shifts the pulse arrival time, and is group-delay dispersion; a Gaussian spectrum with quadratic phase gives a linearly chirped Gaussian pulse. Higher orders create more complicated temporal structure. A broad spectrum can therefore support a short pulse without actually being compressed to that duration.
Gaussian time–bandwidth product
Section titled “Gaussian time–bandwidth product”For a transform-limited Gaussian intensity pulse with temporal FWHM ,
Its intensity spectrum is also Gaussian, and the frequency FWHM obeys
Equivalently,
This is not a universal numerical uncertainty relation. The constant changes with pulse shape and with whether widths refer to field amplitude, intensity, RMS width, or FWHM. For example, a transform-limited intensity pulse has .
For a Gaussian spectrum with quadratic phase, chirp increases this FWHM product; Exercise 2 gives the exact broadening factor. An arbitrary spectral phase can create peaks and satellites whose FWHM has no such universal lower-bound interpretation. For finite second moments, the general Fourier bound instead uses RMS widths, .
Duration and selectivity trade off
Section titled “Duration and selectivity trade off”A transform-limited Gaussian pulse has
and therefore
Its wavenumber bandwidth is about . Such a pulse can resolve rapid motion in time while exciting many nearby vibronic transitions. A long narrowband pulse provides better spectral selectivity but poorer direct timing. Multidimensional and pulse-shaping methods recover some frequency selectivity through controlled coherence intervals; they do not repeal Fourier relations.
Pulse duration must be measured
Section titled “Pulse duration must be measured”An optical intensity autocorrelation does not uniquely reconstruct a pulse. It requires an assumed shape and contains no complete spectral-phase information. Methods such as frequency-resolved optical gating (FROG) and spectral-phase interferometry for direct electric-field reconstruction (SPIDER) retrieve or constrain both amplitude and phase under stated assumptions.
Measure the pulse at the sample: windows, objectives, air paths, and nonlinear propagation can alter the pulse after its characterization at the source. Spatial chirp can also make different parts of the beam arrive differently.
Pulses Prepare Wave Packets
Section titled “Pulses Prepare Wave Packets”Coherent excitation of several eigenstates
Section titled “Coherent excitation of several eigenstates”With , weak first-order excitation from to gives, in the absorption approximation,
A narrowband pulse may select one eigenstate. A broadband phase-coherent pulse can prepare an excited component spanning several eigenstates. After conditioning on excitation and normalizing its amplitudes, write
Subsequent closed evolution gives
For an observable ,
The diagonal terms carry populations. Off-diagonal terms produce quantum beats when the observable and probe retain sensitivity to their relative phase.
Density-operator form
Section titled “Density-operator form”For an ensemble, a model with independent coherence evolution can give, for ,
summarizes dephasing in a chosen model. It need not be linear in ; static Gaussian disorder, Markovian phase noise, spectral diffusion, and non-Markovian environments produce different functions. This multiplicative form does not describe general population transfer or coupling between different coherences; those require coupled equations. The complete density matrix must remain positive and normalized.
A pump pulse can create simultaneously:
- excited-state populations ;
- electronic coherences between electronic eigenstates;
- vibrational coherences within one electronic manifold;
- vibronic coherences involving mixed electronic and nuclear character;
- orientational anisotropy in an ensemble;
- spatial gratings or other collective optical coherences.
A measured oscillation does not identify which category is present. Its frequency, phase, polarization dependence, excitation spectrum, temperature dependence, isotope dependence, and dephasing must all be tested.
Nuclear wave packets
Section titled “Nuclear wave packets”In a molecular adiabatic expansion,
A short electronic excitation acts over a nuclear configuration distribution and prepares one or more nuclear wave packets . Their evolution can include:
- motion on anharmonic potential-energy surfaces;
- dispersion and revivals;
- branching into different nuclear regions;
- nonadiabatic transfer between electronic surfaces;
- entanglement between electronic and nuclear degrees of freedom;
- environmental decoherence and relaxation.
A localized wave packet can resemble a classical packet for some observables and times, but it is not a point following one trajectory. Wave Packets develops the general superposition language.
Pump–Probe Logic
Section titled “Pump–Probe Logic”The IUPAC pump–probe definition emphasizes a strong pump that initiates a process and a delayed weaker probe that monitors an optical property. Modern experiments extend the same logic to XUV, X-ray, photoelectron, ion, electron-diffraction, and other probes.
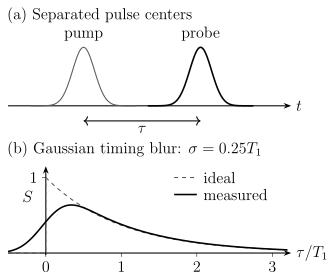
Top: the pulse centers define delay . Bottom: a causal exponential (dashed) and its actual convolution with a normalized Gaussian IRF of standard deviation (solid). Rounding and apparent negative-delay signal arise from finite pulse timing, without any response preceding excitation. This convolution models an incoherent, time-translation-invariant measurement, not arbitrary overlapping-field dynamics.
Differential absorption
Section titled “Differential absorption”For a transmission experiment, one common convention is
Positive means less transmitted probe under this convention; negative means more. Other communities report , , optical density, or a heterodyne field with different signs. The displayed color map is uninterpretable until the definition and phase convention are known.
In a common electronic transient-absorption picture, three contributions are often discussed:
- Ground-state bleach: pump depletion reduces ground-state absorption.
- Stimulated emission: the probe stimulates emission from an excited state.
- Excited-state absorption: the probe promotes the prepared system to a higher state.
Bleach and stimulated emission often appear with the same sign in , while excited-state absorption often has the opposite sign. This is not a universal assignment rule. Overlapping bands, refractive signals, coherent pathways, scattering, heating, and population-dependent line shifts can reverse or mix apparent features.
Pump–probe is nonlinear response
Section titled “Pump–probe is nonlinear response”In weak optical pump–probe spectroscopy, two pump field interactions prepare a population or coherence and a probe interaction generates a third-order polarization. Schematically,
contains nested commutators and propagators of the material system. Distinct Liouville-space pathways can reach the same detected frequency and interfere. The delay trace is therefore not generally equal to one excited-state population.
The Linear Response Preview introduces response functions. Full nonlinear-response and multidimensional derivations are developed by Mukamel and Cho in the references.
Pulse overlap and time zero
Section titled “Pulse overlap and time zero”Near zero delay, pump and probe overlap in the sample. The signal can contain coherent artifacts, cross-phase modulation, four-wave mixing, two-photon absorption, or pump-induced probe reshaping. These terms may be useful, but they are not automatically an ultrafast population rise.
Time zero can depend on:
- probe wavelength because of dispersion;
- sample position and thickness;
- beam angle and pulse-front tilt;
- nonlinear crystal or reference material;
- data-processing and phase conventions.
A broadband probe may therefore require a wavelength-dependent time-zero correction. Applying an empirical correction without reporting it can manufacture or erase apparent dynamics.
Instrument Response
Section titled “Instrument Response”Convolution
Section titled “Convolution”When finite duration acts as independent, time-translation-invariant blurring of an otherwise specified response, a useful model is
For incoherent intensity gating, can include the pump–probe intensity cross-correlation, timing jitter, group-velocity mismatch, and additional gates. Coherent pulse overlap instead requires field amplitudes and response pathways, and need not reduce to this single convolution. A slow detector that integrates each shot does not automatically limit the scanned-delay resolution; its response matters directly when arrival times or a time-dependent electronic signal are resolved. If the applicable contributions are independent Gaussians with FWHM values , then
For a pump, probe, and timing-jitter width, all expressed as Gaussian FWHM values,
Mixing RMS and FWHM widths in this quadrature rule is a common numerical error.
Deconvolution is an inference
Section titled “Deconvolution is an inference”If an observed rise is comparable to the IRF, the intrinsic timescale is not read directly from the graph. It must be inferred from a forward fit. Deconvolution can be ill-conditioned, especially when:
- the IRF is uncertain or non-Gaussian;
- time zero drifts;
- several kinetic components overlap;
- coherent artifacts contribute;
- the signal has wavelength-dependent response;
- the assumed kinetic model is too restrictive.
A fit can estimate a timescale shorter than the nominal IRF when the signal-to-noise ratio and response calibration are strong, but the uncertainty and model dependence increase. “Sub-IRF” does not mean impossible; it does mean that visual resolution and parameter inference must not be confused.
Sampling is not resolution
Section titled “Sampling is not resolution”A delay step of does not create temporal resolution. It samples a signal already blurred by the pulses and instrument. Conversely, coarse sampling can alias oscillations even when the pulses are short enough to excite and detect them.
If a beat has angular frequency , the delay sampling interval should satisfy a Nyquist condition,
with a practical margin for fitting phase and damping. The total scan window sets frequency resolution in a delay-axis Fourier transform.
Coherence and Dephasing
Section titled “Coherence and Dephasing”Populations and coherences
Section titled “Populations and coherences”In a basis of energy eigenstates:
is a population, while
is a coherence. A population can decay without oscillating. A coherence usually carries a phase at and can generate beats if the probe couples the interfering pathways to the same detector outcome.
Coherence is basis dependent. Electronic coherence in an adiabatic basis can be represented differently in a diabatic basis, while measurable signals remain invariant when states, operators, and dynamics are transformed consistently.
Ensemble dephasing
Section titled “Ensemble dephasing”Suppose members of an ensemble have static frequency offsets . The ensemble coherence contains
For a Gaussian offset distribution with standard deviation ,
For a Lorentzian offset distribution with HWHM , it is
Thus a fitted exponential is not proof of Markovian environmental dephasing, and a Gaussian decay is not automatically instrumental. Echo and rephasing methods can separate some reversible inhomogeneity from irreversible phase loss.
Population relaxation also destroys coherence
Section titled “Population relaxation also destroys coherence”For a Markovian two-level model with exponential inversion relaxation time , coherence decay time , and independent pure-dephasing time ,
Ultrafast experiments often involve multilevel manifolds, spectral diffusion, non-exponential kinetics, and evolving bases, so this relation must not be applied mechanically to every beat envelope. The same caution is developed in Dephasing vs Dissipation.
A beat frequency alone cannot identify the states involved. For example, impulsive Raman excitation can create ground-state vibrational coherence in the same detection region as excited-state motion. Pump-frequency, polarization, isotope, and probe-window changes test these alternatives through their predicted amplitudes and phases.
Molecular Dynamics
Section titled “Molecular Dynamics”Vertical preparation and subsequent motion
Section titled “Vertical preparation and subsequent motion”The Franck–Condon picture says that an electronic transition samples the initial nuclear wavefunction before substantial nuclear motion during the optical interaction. After the pulse, the prepared nuclear wave packet evolves on one or more electronic surfaces.
Pulse duration, bandwidth, and transition dipoles determine the initial wave packet. Potential surfaces and derivative couplings determine its closed-system evolution. Solvent, phonons, collisions, and radiation add open-system dynamics.
Probe windows convert motion into signal
Section titled “Probe windows convert motion into signal”Suppose a probe ionizes only where an ionic potential surface is accessible. Then the photoelectron yield can peak when a nuclear wave packet enters that geometry region. A different probe photon energy can define a different window and shift or remove the peak without changing the underlying dynamics.
Likewise:
- transient absorption follows energy gaps and transition dipoles that evolve with nuclear configuration;
- fluorescence follows emissive states and radiative selection;
- diffraction weights pair correlations and scattering factors;
- photoelectron angular distributions weight continuum partial waves;
- ion fragments weight dissociation and detection efficiencies.
Geometry is therefore inferred by comparing multiple observables with a forward dynamical model. One spectral maximum is not a Cartesian coordinate.
Nonadiabatic dynamics
Section titled “Nonadiabatic dynamics”Where a wave packet encounters appreciable nonadiabatic coupling, one surface may no longer suffice. Proximity to an avoided crossing alone does not guarantee transfer: velocity, gap, coupling, and the packet’s direction also matter. Population can branch, electronic coherence can be created or lost, and the probe can mix signals from several electronic characters.
Nonadiabatic Coupling develops derivative couplings and dynamics methods. Conical Intersections explains why one optimized minimum-energy intersection is not itself a time-resolved mechanism.
Ultrafast data can constrain access times, branching, and product formation, but a proposed crossing time must be distinguished from wave-packet arrival at a probe window, for example by varying probe energy and comparing a calculated multichannel response.
Femtosecond Regime
Section titled “Femtosecond Regime”One femtosecond is
Femtosecond pulses overlap many molecular and condensed-matter timescales:
| Process | Illustrative scale | Qualification |
|---|---|---|
| Electronic dephasing and charge redistribution | few femtoseconds to hundreds of femtoseconds | Strongly system and environment dependent |
| Molecular vibration | roughly – periods | Light-atom stretches are faster than torsions and collective modes |
| Internal conversion and intersystem crossing | femtoseconds to nanoseconds | Coupling, energy gaps, and density of states matter |
| Solvation and dielectric response | tens of femtoseconds to many picoseconds | Often multicomponent and solvent specific |
| Energy and charge transfer | femtoseconds to nanoseconds | Coherent and incoherent regimes can coexist |
| Bond rearrangement and fragmentation | tens of femtoseconds onward | Detection may occur long after decisive branching |
These ranges overlap. “Electronic is fast, nuclear is slow” is a useful scale-separation intuition, not a universal assignment rule.
Femtochemistry
Section titled “Femtochemistry”Femtochemistry established that pump–probe observables can follow molecular wave packets through regions connecting reactants and products. The central advance was dynamical timing, not direct observation of a classical transition-state structure in every experiment.
Complementary optical, photoelectron, vibrational, diffraction, and X-ray signals constrain different parts of the same dynamics.
Attosecond Regime
Section titled “Attosecond Regime”One attosecond is
Sub-femtosecond pulses require very broad coherent bandwidth. A transform-limited Gaussian pulse has
corresponding to
Extreme-ultraviolet (XUV) and soft-X-ray attosecond pulses are commonly generated through high-harmonic processes and synchronized to a strong infrared field. Their bandwidth can ionize several channels at once, making continuum phases and channel coupling part of the measurement.
Attosecond streaking
Section titled “Attosecond streaking”In a simplified streaking picture, an XUV pulse releases an electron and a synchronized infrared field changes its final momentum according to the vector potential near the release time:
Here , , and ; integrating the electron force gives this SI momentum kick. It neglects the ionic Coulomb force and spatial variation of the laser field. The measured spectrogram is fitted with a propagation model to retrieve pulse timing or photoemission dynamics. Coulomb interaction, continuum–continuum coupling, solid transport, spatial fields, and the retrieval algorithm can all modify the mapping.
RABBITT-type interferometry
Section titled “RABBITT-type interferometry”In reconstruction of attosecond beating by interference of two-photon transitions (RABBITT), neighboring harmonic pathways reach the same photoelectron sideband. A schematic sideband oscillation is
The phase contains both XUV spectral phase and target-dependent two-photon phases. It is not solely a pulse property unless the atomic or molecular contribution is modeled or calibrated.
What an attosecond delay means
Section titled “What an attosecond delay means”For a photoemission amplitude , a narrow outgoing packet has a group delay relative to a specified reference,
Do not confuse its phase with the elastic partial-wave convention : the corresponding scattering delay is . For a long-range Coulomb potential, an absolute delay relative to free propagation does not approach a finite asymptotic limit; a consistent Coulomb/reference prescription or channel difference is needed.
Measured photoemission delays can also contain continuum–continuum phases, channel coupling, electron correlation, transport, and reference-channel contributions. They are phase derivatives inferred from an interferometric measurement, not a universal stopwatch reading for an electron crossing a pre-existing boundary.
Attosecond spectroscopy provides access to electronic polarization, ionization, charge migration, core-hole dynamics, and strong-field wave-packet motion. Nuclear motion can still matter through initial geometry, vibronic entanglement, and longer-delay evolution.
Multidimensional Spectroscopy
Section titled “Multidimensional Spectroscopy”Pump–probe spectroscopy usually scans one principal delay. Coherent multidimensional methods control several intervals, record a phase-matched or phase-cycled signal, and Fourier transform one or more coherence times. A typical third-order sequence distinguishes:
Correlating excitation and detection frequencies can:
- separate homogeneous and inhomogeneous broadening;
- reveal cross peaks associated with coupling or transfer;
- distinguish rephasing and nonrephasing pathways;
- track spectral diffusion during a waiting time;
- isolate phase relationships hidden in a one-dimensional spectrum.
A cross peak is not automatically proof of coherent energy transfer. Anharmonicity, shared states, population transfer, chemical exchange, many-body interactions, and pulse overlap can all create off-diagonal features. Response-function calculations and polarization controls remain essential.
Data Reduction and Inference
Section titled “Data Reduction and Inference”Preprocessing changes the signal
Section titled “Preprocessing changes the signal”Common operations include:
- pump-on/pump-off normalization;
- reference-channel division;
- chirp and time-zero correction;
- detector nonlinearity and dark-count correction;
- scattering and coherent-artifact subtraction;
- singular-value or global kinetic analysis;
- Fourier filtering, apodization, and zero padding;
- coherent averaging and phase correction.
Each operation should be reported. Singular-value components and decay- associated spectra are mathematical decompositions, not automatically physical species.
Kinetic models
Section titled “Kinetic models”A sequential model
predicts a specific set of population traces. A parallel model
can produce similar decays over a limited window. Spectral constraints, independent observables, concentration dependence, temperature dependence, and physical priors are often needed to distinguish them.
Coherent wave-packet dynamics generally cannot be represented by positive species populations alone. A global model may need density-matrix or response-function propagation, not only rate equations.
Worked Examples
Section titled “Worked Examples”Period of a vibrational beat
Section titled “Period of a vibrational beat”A coherence between levels separated by oscillates at
Its period is
A delay step gives about samples per period and satisfies the Nyquist condition for this single beat. More samples improve phase and damping estimation; higher-frequency components can still alias. The useful scan duration also depends on the dephasing time and noise.
Exercises
Section titled “Exercises”Exercise 1: Few-cycle bandwidth
Section titled “Exercise 1: Few-cycle bandwidth”An transform-limited Gaussian pulse has intensity FWHM .
- Find its frequency and energy FWHM.
- Find the carrier optical period.
- Estimate the number of carrier cycles inside the intensity FWHM.
- Explain why carrier-envelope phase can matter.
Solution
The frequency bandwidth is
Using ,
The carrier frequency and period are
Thus the intensity FWHM spans only
carrier cycles. Changing the carrier-envelope phase moves the carrier peaks relative to the envelope, which can alter strong-field ionization and high-harmonic emission for such few-cycle pulses.
Exercise 2: Chirped Gaussian pulse
Section titled “Exercise 2: Chirped Gaussian pulse”A transform-limited Gaussian pulse has . Quadratic spectral phase broadens its intensity FWHM according to
For , find . Does its spectral intensity bandwidth change under pure phase-only dispersion?
Solution
The dimensionless chirp parameter is
Therefore
Ideal phase-only dispersion changes but not , so the spectral intensity bandwidth is unchanged. The time–bandwidth product grows above the transform limit.
Exercise 3: Infer an error-function rise width
Section titled “Exercise 3: Infer an error-function rise width”An increasing error-function signal has a Gaussian time derivative with FWHM . The Gaussian IRF has FWHM . Assume the intrinsic signal also has an error-function rise. Estimate the FWHM of its derivative. Why is the result model-dependent?
Solution
Differentiation commutes with convolution, so the measured derivative is the intrinsic derivative convolved with the IRF. Both are Gaussian. Their variances, and hence their squared FWHM values, add:
Hence
The subtraction assumes Gaussian shapes, independent broadening, a correct IRF, and an error-function rise whose derivative has the stated width. The monotonic rise itself has no peak FWHM. A causal exponential, distributed kinetics, coherent artifact, or wavelength- dependent time zero would require a different forward model.
Exercise 4: Beat frequency and dephasing
Section titled “Exercise 4: Beat frequency and dephasing”A delay trace contains an oscillation at with an exponential envelope time .
- Find the period.
- How many cycles fit within ?
- Give two controls that distinguish an excited-state vibrational coherence from a ground-state impulsive Raman coherence.
Solution
Using ,
Thus
The number of periods in one envelope time is
Useful controls include:
- tune the pump spectrum across the electronic transition and compare the excitation profile of the beat;
- compare oscillation phase and amplitude on ground-state bleach, stimulated-emission, and excited-state-absorption regions;
- change isotope or temperature and compare vibrational shifts;
- use polarization or pulse-sequence controls that suppress impulsive Raman pathways;
- verify persistence outside pump–probe temporal overlap.
No one control is universally decisive; response modeling should combine them.
Exercise 5: Probe-window dependence
Section titled “Exercise 5: Probe-window dependence”Consider
Probe A measures
while probe B measures
Find and . What does the comparison show?
Solution
Probe A sees the population in :
Probe B is coherence sensitive:
The underlying state is identical in both measurements. One probe reports a constant population; the other reports a beat. A delay trace is therefore a property of the state and the probe window.
Exercise 6: Transient-absorption signs
Section titled “Exercise 6: Transient-absorption signs”Under the convention
classify the expected sign of an isolated ground-state bleach, stimulated emission band, and excited-state absorption band. List three reasons this sign dictionary can fail in real data.
Solution
Ground-state bleach reduces absorption, so and . Stimulated emission also adds probe-direction light in the ideal heterodyne picture and normally gives . Excited-state absorption removes additional probe light and normally gives .
The dictionary can fail or become ambiguous because:
- spectral bands overlap;
- pump-induced shifts create derivative-like signals;
- refractive and absorptive quadratures mix;
- coherent pulse-overlap pathways contribute;
- scattering or thermal lensing changes transmission;
- probe chirp maps wavelength to a different effective time zero;
- saturation and multiphoton channels violate the weak-response model.
Signs organize a first assignment; they do not prove it.
Exercise 7: Attosecond bandwidth
Section titled “Exercise 7: Attosecond bandwidth”Estimate the transform-limited Gaussian energy bandwidth of a pulse. Compare it with a separation between two electronic channels. Why does the broad bandwidth complicate rather than prevent time resolution?
Solution
The frequency bandwidth is
Therefore
The pulse coherently spans a range much wider than the channel separation, so it can prepare or ionize both channels. This broad coherent superposition is what supports short temporal structure. It also means the measured signal can contain overlapping channels, continuum phases, and interference that require energy- and angle-resolved detection plus a propagation model.
Exercise 8: Which phase defines the delay?
Section titled “Exercise 8: Which phase defines the delay?”Near , a photoemission amplitude has constant magnitude and phase , with . Find the outgoing packet’s delay using . What would the elastic scattering delay be if instead were the derivative of a partial-wave phase shift ?
Solution
A narrow wave packet contains , so its envelope is shifted by relative to the same spectrum without this phase slope. If and , its phase slope is and the scattering delay is . The factor of two follows from the definition of the amplitude; it is not a discrepancy between experiments. Near a zero of or a rapidly varying resonance, the finite packet may reshape and a single local derivative may not describe its measured peak.
References
Section titled “References”- M. Chergui and E. Collet, “Photoinduced Structural Dynamics of Molecular Systems Mapped by Time-Resolved X-ray Methods,” Chemical Reviews 117, 11025–11065 (2017), doi:10.1021/acs.chemrev.6b00831 — ultrafast X-ray absorption, scattering, and structural inference.
- M. Cho, “Coherent Two-Dimensional Optical Spectroscopy,” Chemical Reviews 108, 1331–1418 (2008), doi:10.1021/cr078377b — nonlinear response and electronic and vibrational 2D methods.
- J.-C. Diels and W. Rudolph, Ultrashort Laser Pulse Phenomena, 2nd ed., Academic Press, 2006, doi:10.1016/B978-0-12-215493-5.X5000-9 — pulse generation, propagation, characterization, and time–bandwidth conventions.
- V. Engel, H. Metiu, R. Almeida, R. A. Marcus, and A. H. Zewail, “Molecular State Evolution after Excitation with an Ultra-Short Laser Pulse: A Quantum Analysis of NaI and NaBr Dissociation,” Chemical Physics Letters 152, 1–7 (1988), doi:10.1016/0009-2614(88)87319-6 — wave-packet forward modeling of an early femtochemical experiment.
- G. R. Fleming, Chemical Applications of Ultrafast Spectroscopy, Oxford University Press, 1986 — pulse, relaxation, and condensed-phase spectroscopy foundations.
- M. Hentschel, R. Kienberger, Ch. Spielmann, G. A. Reider, N. Milosevic, T. Brabec, P. Corkum, U. Heinzmann, M. Drescher, and F. Krausz, “Attosecond Metrology,” Nature 414, 509–513 (2001), doi:10.1038/35107000 — isolated attosecond-pulse metrology and synchronized electron dynamics.
- IUPAC, “pump-probe technique,” Compendium of Chemical Terminology, 5th ed. (2025) — operational definition and third-order optical interpretation.
- D. M. Jonas, “Two-Dimensional Femtosecond Spectroscopy,” Annual Review of Physical Chemistry 54, 425–463 (2003), doi:10.1146/annurev.physchem.54.011002.103907 — rephasing, pathway selection, and two-dimensional spectra.
- D. J. Kane and R. Trebino, “Characterization of Arbitrary Femtosecond Pulses Using Frequency-Resolved Optical Gating,” IEEE Journal of Quantum Electronics 29, 571–579 (1993), doi:10.1109/3.199311 — FROG pulse retrieval.
- F. Krausz and M. Ivanov, “Attosecond Physics,” Reviews of Modern Physics 81, 163–234 (2009), doi:10.1103/RevModPhys.81.163 — high-harmonic sources, attosecond measurement, and strong-field electron dynamics.
- S. Mukamel, Principles of Nonlinear Optical Spectroscopy, Oxford University Press, 1995 — response functions, Liouville pathways, and multidimensional signals.
- P. M. Paul, E. S. Toma, P. Breger, G. Mullot, F. Augé, Ph. Balcou, H. G. Muller, and P. Agostini, “Observation of a Train of Attosecond Pulses from High Harmonic Generation,” Science 292, 1689–1692 (2001), doi:10.1126/science.1059413 — phase-locked harmonics and RABBITT-type characterization.
- R. Pazourek, S. Nagele, and J. Burgdörfer, “Attosecond Chronoscopy of Photoemission,” Reviews of Modern Physics 87, 765–802 (2015), doi:10.1103/RevModPhys.87.765 — Wigner, continuum–continuum, correlation, and measurement contributions to photoemission delays.
- M. Schultze, M. Fieß, N. Karpowicz, J. Gagnon, M. Korbman, M. Hofstetter, S. Neppl, A. L. Cavalieri, Y. Komninos, Th. Mercouris, C. A. Nicolaides, R. Pazourek, S. Nagele, J. Feist, J. Burgdörfer, A. M. Azzeer, R. Ernstorfer, R. Kienberger, U. Kleineberg, E. Goulielmakis, F. Krausz, and V. S. Yakovlev, “Delay in Photoemission,” Science 328, 1658–1662 (2010), doi:10.1126/science.1189401 — state-resolved attosecond photoemission-delay measurement.
- I. A. Walmsley and C. Dorrer, “Characterization of Ultrashort Electromagnetic Pulses,” Advances in Optics and Photonics 1, 308–437 (2009), doi:10.1364/AOP.1.000308 — pulse measurement, ambiguities, and spatiotemporal effects.
- A. H. Zewail, “Laser Femtochemistry,” Science 242, 1645–1653 (1988), doi:10.1126/science.242.4886.1645 — foundational femtochemical pump–probe perspective.