

Absorption and Emission
Absorption removes photons from an incident mode while transferring a system from a lower-energy state to a higher-energy state. Emission adds photons while the system loses internal energy. The elementary gap condition is the same in either direction,
but an absorption spectrum and an emission spectrum are not interchangeable. They weight different initial populations, can involve different branches, and reach the detector through different propagation geometries.
For one line, the central experimental quantities are
Transmission spectroscopy infers matter from the change between an input and an output beam. Emission spectroscopy observes matter acting as a source. Keeping that operational distinction visible prevents several common errors: a large transition matrix element need not produce a tall emission line, an absorption dip need not equal the fraction of systems excited, and a spectrum cannot be interpreted without its populations and optical depth.
Required background. Transition rates relates event probabilities to measured signals; Einstein coefficients defines the absorption and emission coefficients. Oscillator strengths connects E1 matrix elements to integrated absorption.
Here are level number densities and their degeneracies. We use angular frequency , photon flux , irradiance , and radiance per unit solid angle. For an isolated narrow line we extend normalized profiles to the full frequency axis,
Physical spectra have positive frequencies; this extension is a near-resonance approximation. Broad spectra need a physical positive-frequency profile. Line shapes and broadening derives the profiles rather than treating them as prescribed weights.
Absorption
Section titled “Absorption”Microscopic event
Section titled “Microscopic event”For electric-dipole coupling to polarization , the relevant matrix element is
The first-order absorption amplitude is proportional to this matrix element and to the positive-frequency part of the incident field. Energy transfer is resonant when the field contains spectral weight near .
Absorption is therefore not merely “a photon meeting an atom.” It requires:
- population in the lower state;
- spectral and temporal overlap with the transition;
- a nonzero matrix element for the actual polarization and geometry; and
- a response regime consistent with the proposed cross section. Linear stationary response can define a cross section even for a coherent weak probe; a short coherent transient may instead require an amplitude calculation.
For a weak beam, package the intrinsic response into an absorption cross section,
where is the angular-frequency-integrated area, with units . The cross section itself has area units. The excitation rate per lower-state target is
This expression makes a useful separation. The cross section describes the target and declared polarization average; the photon flux describes the source. Neither one alone is a transition rate.
Beer–Lambert attenuation
Section titled “Beer–Lambert attenuation”Consider a collimated probe traversing a dilute sample. If true absorption is the only process removing photons from the detected forward mode,
For a uniform path of length ,
More generally, with a lower-state column density
the optical depth is, provided the cross section is constant along the path,
At small optical depth,
but this linearization is poor for a saturated absorption feature in the propagation sense, meaning . That use of “saturated” must not be confused with dynamical saturation of a driven transition.
Base-ten absorbance is another common convention:
The notation is used here to avoid confusion with an Einstein coefficient.
What a transmission dip actually measures
Section titled “What a transmission dip actually measures”A decrease in the forward detector signal can arise from true absorption, elastic scattering out of the collection aperture, reflection, diffraction, or imperfect normalization against the reference beam. Conversely, spontaneous emission, scattering, or detector background can add light to the forward channel and partially fill an absorption dip.
Accordingly, the Beer–Lambert identification
is a model statement. It is reliable only after the optical geometry and background subtraction justify it.
Spontaneous Emission
Section titled “Spontaneous Emission”Population as a source
Section titled “Population as a source”An upper-state system can emit without an applied resonant field. In free space, let be the total spontaneous rate for one branch. For an isotropic, unpolarized ensemble with emission profile , the spectral emission coefficient is
Its integral over solid angle and angular frequency gives approximately
provided the line is narrow compared with . The corresponding photon emissivity omits the factor . Thus equal photon counts in two lines do not imply equal emitted powers.
If the ensemble is oriented or aligned, the radiation can be anisotropic and polarized. Replace by a normalized angular distribution satisfying
Branches, lifetime, and quantum yield
Section titled “Branches, lifetime, and quantum yield”For several radiative branches from the same upper level,
If nonradiative channels contribute a total rate , then
The radiative quantum yield is
For an isolated excitation followed by complete relaxation, the probability of detecting branch before collection and detector losses is
This factorization separates nonradiative quenching from radiative branching. Observed counts require additional collection efficiency, propagation, and detector response factors.
Optically thin emission
Section titled “Optically thin emission”Along a line of sight with negligible absorption and stimulated emission,
For a uniform source of length with no background,
This is the optically thin limit. Once emitted photons are appreciably reabsorbed, the observed profile no longer follows directly. Radiative transfer must be solved.
Stimulated Emission
Section titled “Stimulated Emission”Emission caused by an occupied mode
Section titled “Emission caused by an occupied mode”Stimulated emission begins in the upper state and is induced by radiation near . In a weak-beam cross-section description,
Stimulated emission increases the occupation of the populated field mode, preserving that mode’s frequency, polarization, and spatial structure. For a coherent incident field this supplies gain with a phase relation to the field; an individual number-state photon has no definite optical phase to copy. Spontaneous emission supplies a source distributed over the available modes.
Under matched line-shape and degeneracy conventions, the Einstein relation implies
The equality is between degeneracy-weighted strengths. It does not generally permit one to set the two cross sections equal.
Net extinction and gain
Section titled “Net extinction and gain”Absorption removes photons from a beam, while stimulated emission adds them. Their weak-field net coefficient is
For matched profiles,
Negative extinction is small-signal gain. It is not a complete laser model: gain saturation, pump kinetics, cavity losses, mode competition, and noise remain to be included.
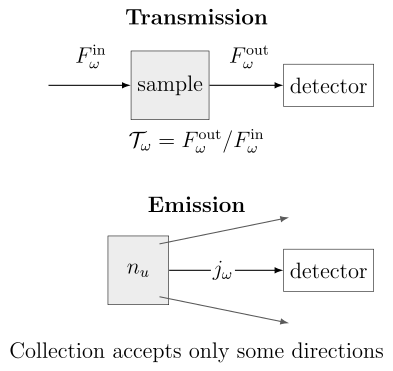
Absorption, stimulated emission, and spontaneous emission share the same level gap, but they enter experiments differently. Transmission compares an output beam with a reference input; emission measures radiance sourced by an upper-state population and filtered by collection optics.
Emission Spectra Versus Absorption Spectra
Section titled “Emission Spectra Versus Absorption Spectra”The same transition can have the same line center
Section titled “The same transition can have the same line center”For isolated stationary levels, both directions obey
An absorption line and the reverse emission line therefore share the same unperturbed transition frequency. Recoil, external fields, collisions, motion, and environment-dependent level shifts can modify the observed center, but there is no intrinsic rule that emission must occur at lower frequency for a two-level atom.
The initial populations are different
Section titled “The initial populations are different”An integrated absorption feature is weighted primarily by the lower-state population,
with a stimulated-emission correction when is not negligible. An optically thin spontaneous-emission line is weighted by the upper-state population and branching rate,
Consequently, line-height or line-area ratios need not agree between the two spectra even when the same set of levels participates.
A spectrum is a network of branches
Section titled “A spectrum is a network of branches”Suppose one upper level connects to several lower levels . Emission can display every radiative branch populated from . Absorption from a cold sample may show only transitions originating in its ground level. Conversely, absorption can probe several populated lower levels that are not fed strongly by the prepared upper state in an emission experiment.
This network viewpoint is more reliable than trying to reflect one spectrum about a chosen frequency and call it the other.
Molecular relaxation and Stokes shifts
Section titled “Molecular relaxation and Stokes shifts”In a molecule or condensed environment, optical excitation can be followed by vibrational relaxation, solvent reorganization, internal conversion, or other nonradiative dynamics before emission. The emitting ensemble then starts from a different distribution than the absorbing ensemble. Emission often occurs at lower photon energy, producing a Stokes shift, but the shift is a dynamical and structural consequence rather than a definition of emission.
Approximate mirror-image relations between molecular absorption and emission bands require restrictive conditions: similar potential-energy curvatures, related vibrational wavefunctions, weak coordinate dependence of the electronic transition moment, and equilibrated sublevel populations. They fail under strong geometry changes, mode mixing, multiple conformers, non-Condon coupling, state-dependent broadening, or incomplete relaxation.
Profiles and spectral coordinates
Section titled “Profiles and spectral coordinates”Absorption and emission profiles can differ because they sample different inhomogeneous ensembles or relaxation histories. Even identical physical profiles look different after a nonlinear coordinate change. Since
a density transforms as
The area representing a conserved quantity is invariant only when the Jacobian is included. A spectral-density maximum and apparent symmetry can change under this Jacobian. By contrast, transmittance, absorbance, and a monochromatic cross section are functions evaluated at a frequency, not densities per frequency. Replotting them requires composition with , without a Jacobian; their extrema map to the same physical frequency.
Self-absorption and radiation trapping
Section titled “Self-absorption and radiation trapping”Emission generated inside an optically thick sample can be reabsorbed before escaping. Photons near the strongest absorption frequency may undergo many absorption and re-emission events, lengthening the escape time and reshaping the observed line. In a spatially inhomogeneous source, cooler foreground material can carve an absorption reversal into an emission feature.
Thus the emergent spectrum can differ substantially from the local spontaneous emissivity. The correct object to propagate is radiance, not a bare Einstein coefficient.
Radiative Transfer
Section titled “Radiative Transfer”Source and extinction terms
Section titled “Source and extinction terms”Along one ray, neglecting frequency redistribution between different frequencies, the transfer equation is
Stimulated emission is included as a negative contribution to ; spontaneous emission appears in the source term . This bookkeeping avoids counting stimulated photons twice.
For a uniform slab with , define
The formal solution is
The solution also extends to negative within the unsaturated constant-coefficient model. At zero net attenuation its finite limit is ; the diverging ratio is then not a useful variable.
For positive attenuation, the same material can appear in absorption or emission relative to a background:
“Absorption line” and “emission line” can consequently describe contrast against a background, not distinct microscopic transitions.
Local thermal equilibrium
Section titled “Local thermal equilibrium”In local thermodynamic equilibrium, microscopic detailed balance gives Kirchhoff’s relation
where the Planck spectral radiance per unit angular frequency is
Thus in LTE. An optically thick uniform source with no external background tends toward the Planck radiance. This statement links local emission and net absorption under equilibrium assumptions; it does not say that every laboratory fluorescence or discharge spectrum is a blackbody.
The historical and thermodynamic derivation of the Planck spectrum is given in Planck’s Radiation Law.
Selection Rules and Intensities
Section titled “Selection Rules and Intensities”Necessary conditions versus quantitative strengths
Section titled “Necessary conditions versus quantitative strengths”A symmetry selection rule tests whether a matrix element vanishes under a declared interaction. For electric-dipole transitions, parity and angular momentum severely constrain . The same conjugate matrix elements connect absorption and stimulated emission, and their mode sum also sets spontaneous emission.
An allowed transition is not guaranteed to be intense. Its measured signal also depends on:
- the magnitude of the nonzero matrix element;
- lower- or upper-state population;
- degeneracy averages and unresolved sums;
- polarization and observation direction;
- frequency factors, including the scaling of a free-space electric-dipole coefficient;
- branching and nonradiative competition;
- line width, because area and peak height are different observables;
- optical depth and reabsorption; and
- collection and detector response.
Likewise, “forbidden” means that a specified leading matrix element vanishes in an idealized symmetry limit. Magnetic-dipole, electric-quadrupole, two-photon, collision-induced, or mixing-enabled channels can still produce observable lines.
Polarization-resolved spectra
Section titled “Polarization-resolved spectra”If magnetic sublevels are resolved, the spherical polarization component selects changes in magnetic quantum number. Absorption prepares an anisotropic excited-state distribution when the pump is polarized. Subsequent emission then carries angular and polarization information about that distribution.
Summing over polarizations or averaging over initial sublevels can erase this information. A database strength quoted for an unresolved level-to-level transition must not be inserted into a polarization-resolved calculation without unpacking its averaging convention.
From intrinsic strength to a measured line
Section titled “From intrinsic strength to a measured line”A useful factorization for an optically thin emission count rate is
where is the number of emitters in the viewed volume and the three factors represent escape or propagation, collection, and detector efficiency. For spectral counts, multiply by the normalized emitted profile and convolve with the instrument response.
For weak absorption, a corresponding detected photon deficit is
only when and additive backgrounds are negligible. These relations show why observed intensity is not a synonym for transition probability.
Temperature Effects
Section titled “Temperature Effects”Thermal populations
Section titled “Thermal populations”For a system in internal thermal equilibrium,
Absorption is weighted by lower-state populations. Raising temperature can deplete a ground-state line, populate rotational or vibrational hot bands, and redistribute intensity over many transitions. Spontaneous emission is weighted by whatever upper-state distribution the preparation and relaxation actually create; that distribution need not be thermal.
Stimulated-emission correction in equilibrium
Section titled “Stimulated-emission correction in equilibrium”In LTE,
For the matched narrow-line profiles assumed above, combining this ratio with the degeneracy-weighted stimulated cross section gives
At optical frequencies and ordinary temperatures, the exponential is often negligible and true absorption dominates. At microwave or far-infrared frequencies, stimulated emission can substantially reduce net attenuation. Omitting this factor biases line intensities and inferred column densities.
Temperature changes more than populations
Section titled “Temperature changes more than populations”Temperature can also change:
- Doppler widths through the velocity distribution;
- collisional widths and shifts through collision rates;
- molecular partition functions and internal populations within each isotopologue;
- chemical composition or ionization balance;
- nonradiative quenching rates; and
- the ambient thermal photon occupation.
One should therefore state what temperature a spectral fit measures. A rotational temperature, vibrational temperature, electronic excitation temperature, translational temperature, and radiation temperature coincide only in genuine equilibrium.
Excitation temperature and inversion
Section titled “Excitation temperature and inversion”For any pair of levels with positive populations, define an excitation temperature by
This is a parametrization, not proof of thermal equilibrium. If , then for the two-level ratio and the line has small-signal gain. Other degrees of freedom can still have positive temperatures.
Worked Example: One Upper Level, Two Lower Levels
Section titled “Worked Example: One Upper Level, Two Lower Levels”Consider nondegenerate levels
At , suppose the two lower levels are thermalized. Their population ratio is
Now prepare level by some independent pump and let
For nondegenerate electric-dipole lines, the reciprocal strength relations give
The ratio of integrated absorption cross sections is therefore
Hence the hot-band absorption area at photon energy is
It is only about of the ground-state absorption area at .
The radiative branching fractions are
For equal collection efficiency and optically thin propagation, the emitted power ratio is
The weaker emission line therefore carries about of the power of the stronger line, even though absorption from its lower state was only about as strong. The transition network is the same; the initial populations are not.
Exercises
Section titled “Exercises”Exercise 1: Infer a cross section from transmission
Section titled “Exercise 1: Infer a cross section from transmission”A dilute sample has lower-state column density . At line center, the measured transmittance is . Assume pure Beer–Lambert absorption. Find the line-center cross section and the base-ten absorbance.
Solution
The optical depth is
Therefore
The base-ten absorbance is
which also equals .
Exercise 2: Photon counts versus emitted power
Section titled “Exercise 2: Photon counts versus emitted power”Two optically thin emission lines produce equal photon rates. Their angular frequencies are and . Compare their photon-count ratio and their radiated-power ratio, assuming equal detector efficiencies.
Solution
The photon-count ratio is one by assumption. Each photon carries energy , so
Equal photon spectra are not equal power spectra.
Exercise 3: Thermal stimulated-emission correction
Section titled “Exercise 3: Thermal stimulated-emission correction”Evaluate the LTE correction
for and . Interpret the result.
Solution
For ,
Net attenuation is only about of the lower-population absorption term; thermal stimulated emission cancels the remaining .
For ,
Stimulated emission is negligible in the second case. This is the usual optical-frequency regime at modest temperature.
Exercise 4: Absorption and emission line ratios
Section titled “Exercise 4: Absorption and emission line ratios”An upper level radiates to two nondegenerate lower levels and . The photon energies are and , while
The lower-state populations satisfy , and the two integrated absorption cross sections are equal. The quoted values are consistent with the nondegenerate electric-dipole relation . Find the absorption-area ratio , the emitted photon-rate ratio , and the emitted-power ratio .
Solution
Equal integrated cross sections give
The optically thin photon-rate ratio is the ratio of coefficients:
Power includes photon energy:
The same transition network produces very different absorption and emission ratios because the initial-state weights differ.
Exercise 5: Solve a uniform transfer slab
Section titled “Exercise 5: Solve a uniform transfer slab”Starting from
derive the emergent radiance of a uniform slab. Then take and evaluate for and for .
Solution
For constant coefficients, multiply by and integrate. With and ,
For and ,
The slab makes a depression relative to the background value . With no incident background,
so the same slab appears in emission.
Exercise 6: A two-line temperature diagnostic
Section titled “Exercise 6: A two-line temperature diagnostic”Two optically thin lines originate from thermalized upper levels and of the same species. Let
and suppose
The measured power ratio is . Neglect optical-depth and detector-response differences. Find the excitation temperature.
Solution
Thermal upper-state populations give
Thus the exponential equals , and
The result is an excitation temperature for the assumed level population model. It equals the kinetic temperature only if the source is thermalized.
Exercise 7: Transform a normalized spectrum
Section titled “Exercise 7: Transform a normalized spectrum”Let be a physical profile normalized over positive angular frequencies. Derive the corresponding wavelength profile and verify its normalization. Why can a symmetric frequency profile be asymmetric in wavelength?
Solution
Conservation of probability or spectral weight requires
Since ,
Changing variables back to gives
The nonlinear map and its Jacobian distort symmetry and shift the plotted maximum.
Exercise 8: Test for population inversion
Section titled “Exercise 8: Test for population inversion”A transition has , , and . Assume matched absorption and stimulated-emission profiles. Determine whether the line has small-signal absorption or gain, and express in units of .
Solution
The degeneracy relation gives
Hence
The coefficient is negative, so the weak probe is amplified. Equivalently, .
Spectroscopy nomenclature distinguishes absorbance, absorptance, optical depth, and extinction; the line-shape reference collects normalized profiles.
References
Section titled “References”- P. F. Bernath, Spectra of Atoms and Molecules, 5th ed., Oxford University Press, 2025, doi:10.1093/oso/9780197754498.001.0001.
- C. Cohen-Tannoudji, J. Dupont-Roc, and G. Grynberg, Atom–Photon Interactions: Basic Processes and Applications, Wiley, 1992.
- W. Demtröder, Laser Spectroscopy 1: Basic Principles, 5th ed., Springer, 2014, doi:10.1007/978-3-642-53859-9.
- C. J. Foot, Atomic Physics, Oxford University Press, 2005.
- R. C. Hilborn, “Einstein coefficients, cross sections, values, dipole moments, and all that,” American Journal of Physics 50, 982–986 (1982), doi:10.1119/1.12937; revised version, arXiv:physics/0202029.
- HITRAN, Definitions and Units, including line intensity, lower-state energy, temperature scaling, absorption coefficient, and optical depth conventions, accessed 2026-10-14.
- IUPAC, “Quantum yield”, Compendium of Chemical Terminology, 5th ed., online version 5.0.0, 2025, doi:10.1351/goldbook.Q04991.
- A. Kramida, “Spectral Lines: Selection Rules, Intensities, Transition Probabilities, Values, and Line Strengths,” in Atomic Spectroscopy: An Introduction, National Institute of Standards and Technology, accessed 2026-10-14.
- R. Loudon, The Quantum Theory of Light, 3rd ed., Oxford University Press, 2000.
- NIST, Atomic Spectra Database: Spectral Lines Help, including definitions of observed intensities, transition probabilities, oscillator strengths, and line strengths, accessed 2026-10-14.
- G. B. Rybicki and A. P. Lightman, Radiative Processes in Astrophysics, Wiley, 1979.