

Electronic Spectroscopy
Electronic spectroscopy observes transitions between electronic energy levels of atoms, ions, molecules, or condensed-phase species. An isolated atom often produces a set of narrow electronic lines split by angular momentum, spin–orbit, hyperfine, Zeeman, or Stark structure. A molecule usually produces vibronic bands because each electronic state supports vibration and rotation, and because its equilibrium geometry and force constants can change upon electronic excitation.
A peak coordinate need not equal a difference between electronic potential minima. Molecular band intensities also depend on vibrational overlaps, initial populations, broadening, and the measured quantity. We first separate these contributions, then examine what absorption and fluorescence can reveal about molecular geometry.
Required background. Oscillator strengths defines integrated transition strengths; Born–Oppenheimer theory supplies electronic surfaces and nuclear wavefunctions.
What Counts as an Electronic Transition?
Section titled “What Counts as an Electronic Transition?”An electronic transition changes the electronic state of the system. For stationary initial and final states,
and one-photon absorption satisfies
This equation is exact for the complete system plus a photon in an idealized energy-conserving transition. Its interpretation depends on what the labels and contain.
Atomic lines
Section titled “Atomic lines”For an atom or ion, an electronic level label may include configuration, term, total electronic angular momentum, parity, hyperfine angular momentum, and external-field quantum numbers:
Here denotes remaining configuration and coupling labels. This is a coupling-based label set: , , , and are not all exact simultaneously in an arbitrary atom or field. Fine structure separates different values; hyperfine interactions separate values; fields can separate magnetic sublevels. The spectrum therefore contains transitions between levels, not merely differences between one-electron orbital energies.
Term Symbol Reference decodes atomic and molecular label conventions, while Atomic Term Symbols, Fine Structure, and Hyperfine Structure develop these labels. The NIST Atomic Spectra Database is an authoritative source for critically evaluated atomic levels, lines, transition probabilities, and related data.
Molecular bands
Section titled “Molecular bands”Within a Born–Oppenheimer description, a molecular state contains electronic, vibrational, rotational, and often spin or parity labels. A useful schematic energy decomposition is
where:
- labels an electronic state;
- is a chosen electronic reference energy;
- is a vibrational term value;
- contains rotational and projection-dependent structure;
- collects spin–orbit, spin–rotation, hyperfine, tunneling, nonadiabatic, field, or other corrections required by the resolution.
A molecular electronic transition generally changes both the electronic and vibrational quantum numbers. IUPAC calls such a process a vibronic transition. Rotational quantum numbers usually change as well, so a resolved gas-phase electronic band is more precisely rovibronic.
Energy-scale hierarchy
Section titled “Energy-scale hierarchy”Typical scales often obey
but this is an orientation rule, not a theorem. Low-lying electronic states, soft vibrations, heavy-atom spin–orbit splittings, Rydberg series, near degeneracies, and condensed-phase interactions can violate a simple hierarchy. The observed resolution also decides whether the spectrum appears as individual lines, rotational contours, vibronic bands, or a smooth envelope.
Electronic minima, band origins, and vertical gaps
Section titled “Electronic minima, band origins, and vertical gaps”Several energies are routinely called an “electronic transition energy.” They answer different questions and should not be interchanged.
Let and be ground- and excited-state potential-energy surfaces along a nuclear coordinate , with equilibrium geometries and . Define the minimum-to-minimum electronic gap
This is an adiabatic electronic gap between clamped-nuclei minima. It does not yet include vibrational zero-point energies.
The 0–0 transition connects the lowest vibrational levels of the two electronic states:
Thus
IUPAC defines zero–zero absorption or emission as a transition between the lowest vibrational levels of two electronic states.
At the ground-state equilibrium geometry, the vertical clamped-nuclei gap is
The excited-state reorganization energy
gives
This identity concerns potential energies at stated geometries. A vertical photon absorption begins in a nuclear wavefunction with finite coordinate and momentum spread, not at one classical point.
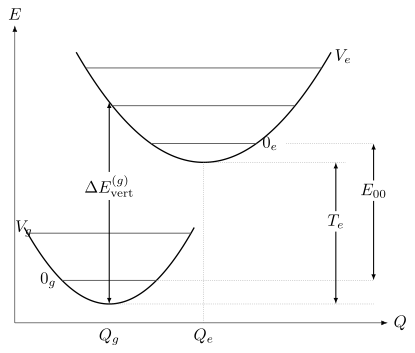
The vertical arrow samples the excited potential near the nuclear configurations occupied before absorption. The adiabatic electronic gap , the 0–0 energy , and a vertical gap are different quantities. A band maximum is not another fundamental gap: it also depends on Franck–Condon factors, populations, line widths, and the spectral coordinate.
Four quantities that are often confused
Section titled “Four quantities that are often confused”| Quantity | Definition | What it describes |
|---|---|---|
| Difference between electronic potential minima | Clamped-nuclei adiabatic electronic gap | |
| Difference between lowest vibronic levels | Spectroscopic band origin when observable | |
| Electronic energy difference at a specified geometry | Sudden clamped-geometry excitation estimate | |
| Band maximum | Maximum of a measured or modeled spectral density | Overlap, population, width, coordinate, and instrument dependent |
The onset of a band is also not automatically . Weak origin intensity, hot bands, finite signal-to-noise, unresolved rotational structure, inhomogeneous tails, predissociation, or an instrumental threshold can move an operational onset.
A numerical comparison
Section titled “A numerical comparison”Suppose and the ground- and excited-state harmonic frequencies are and . Retaining one effective mode,
Using gives
If the excited-state reorganization energy at is , the corresponding clamped-nuclei vertical gap is
The vertical estimate and the 0–0 energy differ by almost here; stating which gap was calculated is necessary for comparison with an observed band.
Franck–Condon Structure
Section titled “Franck–Condon Structure”The Franck–Condon principle states, in its quantum formulation, that vibronic intensity is governed by overlap between vibrational wavefunctions when the electronic transition moment is treated as coordinate independent. Its classical “vertical transition” picture is useful, but the overlap integral is the quantitative statement.
The vibronic transition moment
Section titled “The vibronic transition moment”Write Born–Oppenheimer vibronic states schematically as
and
For electric-dipole absorption, the vibronic transition moment is
where
The full expression contains both electronic response and nuclear motion. The transition-moment definition and its polarization interpretation are standardized in the IUPAC transition moment entry.
The Condon approximation
Section titled “The Condon approximation”If changes slowly over the nuclear region carrying appreciable amplitude, replace it by a representative value:
Then
and the Franck–Condon factor is
The factor is dimensionless. It distributes a parent electronic transition moment among vibronic channels. A band oscillator strength is not generally identical to the electronic oscillator strength times because individual transition frequencies, rotational factors, degeneracies, non-Condon terms, and normalization conventions can differ.
What “the nuclei do not move” really means
Section titled “What “the nuclei do not move” really means”For an impulsive, broadband excitation short compared with relevant vibrational periods, the Condon approximation gives an excited nuclear wavefunction proportional to the initial one. Expanding it in a complete excited-state vibrational basis gives
with a continuum integral when needed. Its components subsequently acquire different phases, producing a moving wavepacket. The nuclei already have quantum position and momentum spreads; they are not classical particles fixed at the equilibrium geometry.
A long narrowband excitation can instead select one resolved stationary vibronic level. Franck–Condon overlaps still determine its transition strength, but do not imply that every absorption experiment prepares the unfiltered impulsive wavepacket. More generally, the pulse spectrum weights each coefficient by its spectral amplitude at the corresponding transition frequency.
Closure and missing intensity
Section titled “Closure and missing intensity”If the excited-state vibrational eigenfunctions form a complete set over all bound and continuum channels,
This is a closure statement for nuclear overlap under a common coordinate measure. For this fixed electronic surface, missing nuclear-overlap weight lies in omitted bound levels or its continuum. An experimental intensity sum is a different quantity: other electronic states, polarization factors, non-Condon moments, populations, and instrumental loss prevent its automatic identification with this unit-normalized overlap sum.
The Displaced Harmonic Model
Section titled “The Displaced Harmonic Model”The most transparent Franck–Condon model uses equal-frequency harmonic potentials displaced by :
Define the dimensionless displacement
and the Huang–Rhys factor
The reorganization energy is
For absorption from the ground vibrational state, the Franck–Condon distribution is Poisson:
Its normalization and moments are
Thus:
- concentrates intensity near the 0–0 transition;
- produces a short progression;
- puts the envelope maximum near and suppresses the origin by .
For ,
| 0 | |
| 1 | |
| 2 | |
| 3 | |
| 4 |
The five entries already contain about of the total overlap. The most intense member is , not the 0–0 line.
Why the vertical gap tracks the envelope
Section titled “Why the vertical gap tracks the envelope”For equal curvatures, the vertical clamped-nuclei gap at the ground minimum is
Because the mean excited vibrational quantum number is and equal frequencies cancel the zero-point difference, the overlap-weighted mean transition energy equals that vertical value exactly in this model. This explains the geometrical construction without turning a continuous potential-energy difference into one exact spectral line.
The actual maximum is discrete, and broadening, frequency factors, thermal population, unequal curvatures, anharmonicity, and coordinate choice can move it.
Geometry from a progression
Section titled “Geometry from a progression”Within the model,
A progression can therefore constrain a geometry change if the active normal coordinate, effective mass, frequency, temperature, and intensity model are known. The sign of is lost in , and several modes can produce similar envelopes. Franck–Condon analysis is an inverse problem, not a direct photograph of a bond-length change.
Polyatomic Franck–Condon Factors
Section titled “Polyatomic Franck–Condon Factors”A polyatomic molecule has many normal coordinates. Ground- and excited-state normal modes need not point in the same mass-weighted directions. In a harmonic model using one common vibrational coordinate space and aligned molecular frames, their dimensional mass-weighted coordinates are related by the Duschinsky transformation
where is an orthogonal rotation of that common space and has the same units as : length times square root of mass. If instead each mode is scaled by its own frequency to dimensionless coordinates, the transformation generally ceases to be orthogonal. Wavefunctions and integration measures must then be transformed with the appropriate Jacobian; one cannot insert dimensionless displacements into the dimensional formula unchanged. Large geometry changes also require care in separating vibrations from rotations.
Even in a harmonic treatment, a realistic calculation may require:
- equilibrium geometries for both electronic states;
- mass-weighted Hessians and frequencies for both states;
- consistent atom ordering, orientation, and phase conventions;
- the Duschinsky matrix and displacement ;
- temperature-dependent initial populations;
- rotational, spin, and electronic factors;
- line shapes and an instrument model.
The multidimensional overlap is
Mode mixing means a visible progression need not belong to one unchanged normal mode. Isotopic substitution is especially informative because it changes masses and normal coordinates while leaving the electronic potential, within the Born–Oppenheimer approximation, nearly unchanged.
Anharmonic and nonadiabatic limits
Section titled “Anharmonic and nonadiabatic limits”The harmonic Franck–Condon model becomes unreliable when:
- high vibrational quanta sample anharmonic regions;
- large-amplitude torsions or inversions are important;
- dissociation or predissociation is accessible;
- electronic surfaces approach or intersect;
- Herzberg–Teller or stronger vibronic coupling dominates;
- solvent coordinates reorganize strongly;
- several conformers or sites contribute.
Anharmonic nuclear Hamiltonians, explicit vibronic models, wavepacket propagation, or ensemble sampling may then be required. The correct upgrade depends on which assumption failed.
Vibronic Band Structure
Section titled “Vibronic Band Structure”For a diatomic or an effectively one-dimensional progression, a vibronic band origin obeys
when all terms are expressed as wavenumbers relative to compatible minima. Including rotation,
The line list is therefore a nested structure:
Origins, progressions, and sequences
Section titled “Origins, progressions, and sequences”A band origin is the transition frequency after the chosen rotational contribution has been removed. The 0–0 origin connects and .
A progression changes the final-state vibrational quantum number while the initial vibrational state is fixed:
Its spacing primarily probes the upper-state vibrational term values.
A sequence changes corresponding quanta in both electronic states, such as
If the two vibrational frequencies are similar, sequence bands can crowd near one another.
Hot bands
Section titled “Hot bands”At finite temperature, initial excited vibrational states have populations
Transitions from are hot bands. Cooling a molecular beam can suppress them; heating strengthens them. A weak red-side feature is not automatically a separate electronic state.
For a harmonic mode,
before degeneracy factors. Temperature scaling can therefore distinguish hot bands from impurities, isotopologues, or unrelated electronic transitions.
Rotational contours
Section titled “Rotational contours”Each vibronic band contains rotational branches. A leading electric-dipole transition can permit
with excluded, subject to parity and electronic projection rules. The surviving branches are conventionally labeled
Not every electronic transition has all three. The rotational constants usually change between electronic states, so line spacings and the overall contour carry geometry information. At lower resolution, branch heads and temperature-dependent envelopes may remain visible even when individual lines do not.
Rotational Spectroscopy derives rigid-rotor energies, rotational populations, and structural inference. Rovibrational Coupling develops corrections beyond separated vibration and rotation.
Bound–free and predissociative structure
Section titled “Bound–free and predissociative structure”If the final electronic surface is repulsive or the photon reaches above a dissociation threshold, the final nuclear state belongs to a continuum. The overlap then becomes a density,
with normalization tied to the continuum convention.
A smooth continuum can therefore be genuine molecular structure rather than instrumental blur. Conversely, a nominally bound level coupled to a dissociative state can acquire a finite predissociation lifetime and broaden. Fano asymmetry may appear when discrete and continuum excitation pathways interfere.
Intensity Beyond Franck–Condon
Section titled “Intensity Beyond Franck–Condon”Franck–Condon factors answer only the nuclear-overlap part of an intensity problem. The electronic transition moment, photon frequency, rotational factor, population, polarization, and line profile remain.
Band-strength factorization
Section titled “Band-strength factorization”For an isotropic initial ensemble, with a specified polarization average and an isolated electronic dipole component, the population-weighted integrated absorption cross section has the schematic form
Here contains the angular and magnetic-substate factors under that convention. Do not multiply it by an additional orientation average that counts those factors again. Resolved polarization amplitudes or several interfering body-fixed components require their coherent sum before squaring. Other observables have other frequency weights: a free-space spontaneous-emission rate scales as instead of .
Herzberg–Teller coupling
Section titled “Herzberg–Teller coupling”When the electronic transition moment changes appreciably with normal coordinates, expand it:
The constant term produces Franck–Condon activity. The linear terms are usually called Herzberg–Teller contributions. They can:
- lend intensity to a Condon-forbidden electronic transition;
- activate particular non-totally-symmetric vibrations;
- alter progression envelopes and polarization;
- interfere constructively or destructively with Condon amplitudes.
For a component , a first-order vibronic matrix element requires
Here denote electronic states for this derivative test; the final-state irrep is dualized, which matters for complex representations. The nuclear factor must also be nonzero. is the totally symmetric irrep. A vibrational mode can therefore supply the missing symmetry needed by an electronically forbidden transition.
Herzberg–Teller activity is not a violation of symmetry. It is an allowed matrix element of a less truncated transition-moment expansion.
Intensity borrowing and state mixing
Section titled “Intensity borrowing and state mixing”Suppose a dark electronic state mixes weakly with a bright state :
If
then
The borrowed intensity scales as only when the bright amplitude is the sole leading contribution. Near resonances, several mixing paths and interference terms may matter.
Spin and Symmetry Rules
Section titled “Spin and Symmetry Rules”A selection rule is a statement about a matrix element under a specified Hamiltonian, state-label approximation, and interaction operator. For electric-dipole absorption,
The transition is absent in that model only if every experimentally sampled component vanishes.
Molecular point-group rule
Section titled “Molecular point-group rule”For exact point-group irreps,
is required. The Cartesian dipole components transform like , , and . This test predicts both activity and polarization.
A failure of the product test is an exact zero only as long as:
- the assumed symmetry is exact;
- the states have the stated irreps;
- the interaction is restricted to that dipole component;
- symmetry-breaking fields, environments, and isotopic effects are absent.
Molecular Symmetry develops irreducible representations and symmetry-adapted state construction.
Parity and inversion
Section titled “Parity and inversion”The electric dipole is odd under inversion. For states of definite parity, an electric-dipole transition therefore requires opposite parity:
For centrosymmetric molecules, the corresponding label is
while and are E1 forbidden in the strict inversion-symmetric model. Vibronic coupling through an ungerade mode, static distortion, a solvent environment, or higher multipoles can open nominally forbidden electronic bands. Symmetry-preserving vibronic coupling never violates the full-state E1 parity rule: an odd vibrational factor supplies the required change in total vibronic parity.
Atomic electric-dipole baseline
Section titled “Atomic electric-dipole baseline”For exact atomic total angular momentum and parity, leading E1 radiation requires
and a parity change. Magnetic-sublevel rules are
with the observed component selected by polarization and geometry.
In pure coupling, commonly quoted additional rules are
with . These are coupling-limit statements, not exact laws of the full relativistic atom. The NIST Atomic Spectroscopy Compendium tabulates the rigorous and approximate E1 rules and their notation.
Atomic Selection Rules derives these rules and their multipole extensions.
Linear-molecule projection rules
Section titled “Linear-molecule projection rules”For a linear molecule, the body-fixed electronic orbital projection obeys the electric-dipole condition
A transition polarized parallel to the molecular axis has ; a perpendicular transition has . Spin, reflection, inversion, total-angular-momentum, and rotational parity rules must still be applied.
Spin is an approximate separator
Section titled “Spin is an approximate separator”The nonrelativistic electric-dipole operator does not act on spin, so pure spin functions give
Spin–orbit coupling mixes different-spin basis states. If a triplet-like state contains a singlet amplitude,
then excitation from a singlet ground state has
Intercombination intensity is therefore expected, especially for strong spin–orbit coupling or near-degenerate states. “Spin forbidden” means weak in a stated coupling model, not impossible in nature.
Rule hierarchy
Section titled “Rule hierarchy”| Rule | Typical status | Common opening mechanism |
|---|---|---|
| Exact parity under an inversion-symmetric E1 Hamiltonian | Exact within model | Symmetry breaking or higher multipoles |
| Full-state point-group dipole product | Exact within stated symmetry | Actual symmetry breaking or a different operator; vibronic states must already be included in the product |
| Approximate | Spin–orbit mixing | |
| Coupling-limit rule | Electronic-state mixing | |
| Small Franck–Condon overlap | Propensity, not prohibition | Geometry, anharmonicity, mode mixing |
For a weak band, identify the vanishing zeroth-order matrix element and the physical interaction that makes the observed transition possible.
Absorption Bands as Measured Signals
Section titled “Absorption Bands as Measured Signals”An electronic absorption spectrum is a propagation measurement. For a uniform sample with number density , path length , and absorption cross section ,
Define optical depth
The base-10 absorbance is
The logarithm linearizes ideal single-pass attenuation. It does not remove reflection, scattering, saturation, stray light, fluorescence reaching the detector, chemical change, or concentration gradients.
From a line list to a band
Section titled “From a line list to a band”A useful forward model is
with normalized profiles
Here is the initial-state population and is an integrated line strength in a declared convention. This decomposition separates four questions:
- Where is the transition? Determine .
- How much integrated strength does it carry? Determine .
- How is that strength distributed in frequency? Determine .
- How does the instrument record it? Convolve with the response and add backgrounds.
Peak height mixes all four. Integrated area is usually closer to a transition-strength observable, but only after baseline, overlap, optical depth, and coordinate conventions are controlled.
Why molecular electronic bands are broad
Section titled “Why molecular electronic bands are broad”Unresolved width can arise from:
- dense rotational and vibronic structure;
- finite excited-state lifetime or predissociation;
- collisions and pure dephasing;
- Doppler motion;
- solvent and lattice fluctuations;
- conformer, site, or isotope distributions;
- spectral diffusion;
- instrument resolution;
- nonlinear absorption or sample degradation.
Several mechanisms can coexist. A single Gaussian fit is a parameterization, not automatically a microscopic explanation.
Gas, matrix, solution, and solid spectra
Section titled “Gas, matrix, solution, and solid spectra”The same chromophore can look very different in different environments.
| Environment | Common spectral features | Main cautions |
|---|---|---|
| Cold molecular beam | Sparse origins and resolved contours | Nonthermal state selection, weak signal |
| Room-temperature gas | Rotational envelopes and hot bands | Doppler and collisional broadening |
| Rare-gas matrix | Sharpened but site-shifted bands | Multiple trapping sites and matrix perturbation |
| Solution | Broad solvatochromic envelopes | Solvent response, reorganization, aggregation |
| Crystal or solid | Excitons, phonon sidebands, anisotropy | Domain orientation, defects, reabsorption |
An environmental shift is part of the Hamiltonian and response of the measured system. It should not be silently compared with a gas-phase clamped-nuclei calculation.
Spectral coordinates and Jacobians
Section titled “Spectral coordinates and Jacobians”Let be an integrated spectral contribution. Under a monotonic coordinate change ,
For ,
For vacuum wavenumber in compatible length units,
A photon-count density per nanometer therefore cannot be relabeled as per inverse centimeter: its Jacobian can move a maximum while preserving integrated counts. Transmittance, absorbance, and a monochromatic cross section are scalar functions, however. Replotting them requires only evaluation at the corresponding frequency, without an ordinate Jacobian. Their maxima remain at the same physical photon energy.
Connecting Absorption to Fluorescence
Section titled “Connecting Absorption to Fluorescence”Absorption prepares an excited-state population or coherence. Fluorescence is one possible later decay channel. Between the two, the system may undergo:
- vibrational wavepacket motion;
- vibrational cooling and solvent relaxation;
- internal conversion;
- intersystem crossing;
- conformational change or charge transfer;
- energy transfer;
- dissociation or photochemistry;
- radiative emission.
The absorption and fluorescence spectra therefore need not involve the same initial nuclear distribution.
Kasha’s rule and its limits
Section titled “Kasha’s rule and its limits”The Kasha rule is the empirical tendency for a polyatomic molecule to luminesce with appreciable yield from the lowest excited state of a given multiplicity. IUPAC explicitly notes exceptions.
The statement is plausible when internal conversion and vibrational relaxation within a multiplicity are faster than emission. It can fail when:
- upper-state radiative decay competes successfully;
- energy gaps suppress internal conversion;
- states are weakly coupled by symmetry or configuration;
- rigid structures inhibit relaxation;
- excitation creates different conformers or reaction products;
- ultrafast emission or strong-field dynamics intervene.
The related Kasha–Vavilov rule, that luminescence quantum yield is independent of excitation wavelength, is also an empirical rule with exceptions. Excitation-dependent emission is a clue to competing species, states, dynamics, optical artifacts, or breakdown of rapid equilibration.
The 0–0 origin and the Stokes shift
Section titled “The 0–0 origin and the Stokes shift”After relaxation on the excited surface, fluorescence often begins near its lowest populated vibronic levels and terminates in several ground-state vibrational levels. Its band maximum then lies at lower photon energy than the absorption maximum.
IUPAC defines the Stokes shift as the difference between the spectral positions of absorption and luminescence band maxima, or their origins, for the same electronic transition. Those two definitions must not be mixed in one numerical comparison.
The 0–0 energy can be common to absorption and emission in an ideal isolated two-surface model, while their maxima differ because they sample opposite Franck–Condon progressions and different relaxed populations.
When mirror images are expected
Section titled “When mirror images are expected”Approximate mirror symmetry about the 0–0 energy can emerge when:
- absorption begins mainly from ;
- fluorescence begins mainly from relaxed ;
- the two surfaces have similar harmonic frequencies;
- their normal modes are not strongly rotated;
- the Condon approximation is adequate;
- the same electronic pair dominates both spectra;
- broadening is comparable on both sides.
Even then, raw curves may not be mirror images. Absorption and spontaneous emission carry different frequency factors, thermal populations can differ, and emission densities acquire a Jacobian on changing to a wavelength axis. Absorbance itself acquires no density Jacobian. Strong geometry changes, Duschinsky rotation, Herzberg–Teller terms, state-dependent broadening, multiple conformers, self-absorption, or incomplete relaxation destroy the simple relation.
Mirror symmetry is therefore a diagnostic approximation, not an identity.
Excitation spectra are conditional signals
Section titled “Excitation spectra are conditional signals”In a fluorescence excitation experiment, one scans the excitation frequency while monitoring an emission channel. A schematic detected signal is
where is incident photon flux, is the fluorescence quantum yield into the monitored species and channel, and summarizes emission-window and detector response.
In the optically thin limit,
A corrected excitation spectrum follows the absorption spectrum only when:
- incident photon flux is corrected;
- the sample is optically thin or inner-filter effects are modeled;
- fluorescence yield is independent of excitation energy;
- the same emitting species is reached;
- detection efficiency and emission shape are effectively constant;
- saturation, photochemistry, and reabsorption are negligible.
IUPAC defines an excitation spectrum as emission output plotted against excitation coordinate and distinguishes a corrected spectrum from an uncorrected one. Equality with absorption is not part of the definition.
Exercises
Section titled “Exercises”Exercise 1: Mean excitation energy for unequal curvatures
Section titled “Exercise 1: Mean excitation energy for unequal curvatures”Let and . Absorption starts in the ground vibrational state. In the Condon limit, use completeness to find the mean transition energy weighted by Franck–Condon overlaps. How does it differ from the clamped-nuclei gap at ?
Solution
Completeness turns the spectral mean into . The identical nuclear kinetic operators cancel. Since and ,
The first two terms are the vertical gap at the ground minimum. The last term accounts for the initial wavefunction’s finite spread sampling unequal curvatures. It vanishes for equal frequencies. This is an overlap-weighted mean, not the maximum or the mean of a spectrum with extra frequency-dependent intensity factors.
Exercise 2: Recover a displacement from successive line strengths
Section titled “Exercise 2: Recover a displacement from successive line strengths”In a cold one-mode equal-frequency Condon progression, corrected nuclear-overlap weights satisfy . Find , the reorganization energy for , and the fraction in the 0–0 line. Can the sign of the coordinate displacement be determined?
Solution
The Poisson ratios obey , so . Then and . Since , the progression alone does not determine the sign of . Raw peak heights need correction for frequency factors, line widths, and the detection response before using this ratio.
Exercise 3: Normalize the displaced-oscillator distribution
Section titled “Exercise 3: Normalize the displaced-oscillator distribution”Show that
is normalized and has mean vibrational quantum number . What energy-scale relation follows for equal-frequency surfaces?
Solution
The exponential series gives
For the mean,
The mean vibrational excitation energy is therefore . In the equal-curvature displaced model this equals the reorganization energy
which is why the Franck–Condon envelope is centered near the vertical potential-energy gap. This statement concerns a mean or envelope, not one mandatory spectral line.
Exercise 4: Herzberg–Teller activation
Section titled “Exercise 4: Herzberg–Teller activation”In the point group , the initial and final electronic states both have irrep , while the relevant dipole component has irrep .
- Is the Condon electronic transition allowed?
- Can a vibration of irrep activate it through a linear Herzberg–Teller term?
Use the products and .
Solution
The Condon product is
It does not contain the totally symmetric irrep , so the Condon electronic transition is forbidden.
For a vibration, the linear term has product
The vibronic transition is therefore allowed at first Herzberg–Teller order. Symmetry has not been broken; the larger operator–state product is totally symmetric.
Exercise 5: Spin–orbit borrowed intensity
Section titled “Exercise 5: Spin–orbit borrowed intensity”A triplet-like state contains a singlet amplitude . Assume its only electric-dipole amplitude from a singlet ground state comes from this mixing.
- Estimate its intensity relative to the corresponding pure singlet transition.
- If the allowed singlet transition has a radiative lifetime, estimate the mixed state’s radiative lifetime under the same frequency and branching assumptions.
Solution
The amplitude is reduced by , so the intensity ratio is
A radiative rate scales with the same squared amplitude. Therefore
This is only a radiative estimate. Nonradiative decay, different transition frequency, other mixed states, and additional branches can change the observed lifetime.
Exercise 6: Convert the ordinate as well as the axis
Section titled “Exercise 6: Convert the ordinate as well as the axis”A spectrum is reported as a photon-count density per . Derive its density per centimeter of wavelength. Evaluate the Jacobian at , and convert that photon wavelength to energy.
Use .
Solution
With compatible length units,
Conservation of counts gives
At ,
The numerical density also depends on whether the wavelength ordinate is per centimeter, nanometer, or another unit; the unit conversion must accompany the Jacobian.
The photon energy is
Changing only tick labels would not preserve integrated area.
Exercise 7: Optical depth and absorbance
Section titled “Exercise 7: Optical depth and absorbance”A gas has number density , path length , and line-center cross section .
Find the optical depth, transmittance, and base-10 absorbance. Is the optically thin approximation accurate to better than for the absorbed fraction?
Solution
The optical depth is
Therefore
and
The exact absorbed fraction is
The optically thin estimate would be , which is about larger than the exact absorbed fraction:
It is therefore not accurate to better than .
Exercise 8: Distinguish an excitation shoulder from a new monomer state
Section titled “Exercise 8: Distinguish an excitation shoulder from a new monomer state”A solution-phase fluorophore has an excitation spectrum that matches its absorbance spectrum from to but develops a new long-wavelength shoulder above a concentration threshold. The emission spectrum also changes shape with excitation wavelength.
List at least four hypotheses and a control for each. Explain why the new shoulder cannot yet be assigned to a new electronic state of the isolated monomer.
Solution
Reasonable hypotheses and controls include:
| Hypothesis | Control |
|---|---|
| Aggregate or excimer precursor | Concentration series, diffusion, and low-temperature measurements |
| Inner-filter or self-absorption artifact | Shorter path length, front-face geometry, and radiative-transfer correction |
| Impurity with distinct fluorescence yield | Purification, chromatography, mass spectrometry, and emission-window dependence |
| Photoproduct | Time and dose dependence, fresh sample, and flow cell |
| Multiple conformers or protonation states | Temperature, pH, solvent, and time-resolved emission |
| Detector or source correction error | Calibrated lamp, reference fluorophore, and response correction |
| Energy transfer between species | Donor lifetime and acceptor-concentration dependence |
An excitation spectrum is proportional to absorption only after weighting by excitation photon flux, absorbed fraction, fluorescence yield, and detection efficiency. The concentration threshold and excitation-dependent emission already indicate that at least one of these factors changes. A new isolated monomer state is only one of several possibilities and is not the most direct inference without the controls.
Fluorescence and phosphorescence develops the subsequent radiative and nonradiative branching, while ultrafast spectroscopy examines pulse-dependent state preparation and its dynamics.
References
Section titled “References”- P. F. Bernath, Spectra of Atoms and Molecules, 4th ed., Oxford University Press, 2020 — modern account of atomic and molecular line and band structure.
- G. Herzberg, Molecular Spectra and Molecular Structure III: Electronic Spectra and Electronic Structure of Polyatomic Molecules, Van Nostrand, 1966 — foundational treatment of molecular electronic spectra.
- J. M. Hollas, Modern Spectroscopy, 4th ed., Wiley, 2004 — accessible treatment of electronic spectra, Franck–Condon structure, and selection rules.
- IUPAC, “electronic transition,” Compendium of Chemical Terminology, 5th ed. (2025), accessed 2026-10-14. — current terminology for electronic transitions.
- IUPAC, “Franck–Condon principle,” Compendium of Chemical Terminology, 5th ed. (2025), accessed 2026-10-14. — classical vertical picture and quantum overlap definition.
- IUPAC, “Kasha rule,” Compendium of Chemical Terminology, 5th ed. (2025), accessed 2026-10-14. and “Kasha–Vavilov rule” — carefully qualified photophysical rules and their exceptions.
- IUPAC, “transition moment,” Compendium of Chemical Terminology, 5th ed. (2025), accessed 2026-10-14. — dipole-transition amplitude, polarization, and vibronic factorization.
- IUPAC, “vibronic transition,” Compendium of Chemical Terminology, 5th ed. (2025), accessed 2026-10-14. — terminology for simultaneous electronic and vibrational changes.
- J. R. Lakowicz, Principles of Fluorescence Spectroscopy, 3rd ed., Springer, 2006 — fluorescence spectra, yields, lifetimes, and experimental artifacts.
- NIST, Atomic Spectra Database — critically evaluated atomic energy levels, wavelengths, and transition data.
- NIST, Atomic Spectroscopy Compendium: Atomic Spectroscopy — authoritative atomic notation and electric-dipole selection rules.
- E. B. Wilson Jr., J. C. Decius, and P. C. Cross, Molecular Vibrations, Dover, 1980 — normal coordinates and molecular vibration underlying multidimensional Franck–Condon analysis.
- R. N. Zare, Angular Momentum: Understanding Spatial Aspects in Chemistry and Physics, Wiley, 1988 — angular momentum, polarization, and line strengths.