

Quantum Oscillations
Quantum oscillations are repeated changes in measured quantities caused by Landau-quantized electronic orbits crossing the chemical potential. They are usually nearly periodic in inverse magnetic field, not in field. Their frequencies constrain extremal Fermi-surface areas; their temperature and field dependence constrain cyclotron masses and quantum lifetimes; their angular dependence constrains three-dimensional geometry. Phase can carry wave-function information, but only after the observable, dimensional correction, spin splitting, orbital magnetic moment, and indexing convention are controlled.
The raw record may be a resistance, conductivity, magnetization, torque, contactless susceptibility, sound velocity, thermoelectric coefficient, or another response. An oscillatory trace is therefore not a direct picture of a Fermi surface. It is the output of a forward model linking a particular orbit to a particular detector.
A sharp Fourier peak constrains an orbit area. Identifying the pocket, its carrier sign, or its geometric phase requires more information than that peak alone.
Required background. Fermi Surface supplies extremal orbit geometry, while Landau Levels supplies magnetic quantization and level degeneracy. Transport Measurements supplies field-sweep, contact and excitation checks. Conventions for Quantum Matter fixes the wavevector, energy and charge conventions used in the oscillation analysis.
Landau levels and visible oscillations
Section titled “Landau levels and visible oscillations”In the inverse-field and damping formulas below, is the field magnitude. Analyze opposite polarities separately after reducing the signed measurements. We assume closed semiclassical orbits with many occupied Landau levels unless stated otherwise; the last few levels near the quantum limit need a more explicit spectrum.
For a closed orbit, the magnetic field discretizes transverse motion. As the field changes, Landau levels successively pass through the chemical potential and modulate the density of states. Thermal smearing and disorder broadening suppress this modulation. Two useful visibility tests are
where for the orbit under a simple effective-mass description and is the quantum lifetime governing level broadening. These are rough visibility scales rather than sharp thresholds. Thermal damping actually depends on , so already gives very strong suppression. Use the damping factors below to assess a particular experiment. Harmonic number, waveform, spin splitting, detector sensitivity, field range, and background noise all matter.
The transport lifetime need not equal . Small-angle scattering can broaden Landau levels efficiently while relaxing little current, so a sample may have high transport mobility but substantially lower quantum mobility. Conversely, comparing the two lifetimes can diagnose the angular character of scattering only within a stated disorder model.
Quantum oscillations usually require a coherent closed orbit. Their absence does not prove the absence of a Fermi-surface sheet. A heavy cyclotron mass, short , open orbit, spin zero, weak matrix element, unfavorable field orientation, superconductivity, magnetic breakdown, or an inaccessible field range can hide it.
Frequency and orbit area
Section titled “Frequency and orbit area”For magnetic field along a chosen direction, the Onsager relation (1952) gives
is an extremal cross-sectional area in a plane perpendicular to , and is expressed in tesla. A single frequency and field orientation do not reconstruct an entire three-dimensional surface. They identify one extremal orbit subject to an assignment problem.
Frequency does not determine carrier sign. Electron and hole pockets with equal extremal area have the same Onsager frequency. Hall response, thermopower, band calculations, angle dependence, and doping evolution can help identify a pocket, but each brings additional assumptions.
For an approximately circular cross section,
For a genuinely two-dimensional pocket with total unresolved degeneracy , the corresponding sheet density is . Applying that count to a quasi-two-dimensional or multiband material requires care about layer multiplicity, spin splitting, valleys, bilayers, and pockets that are not observed.
Shubnikov–de Haas Measurements
Section titled “Shubnikov–de Haas Measurements”The Shubnikov–de Haas effect is an oscillation of a transport coefficient. In a standard experiment, a four-terminal longitudinal or transverse voltage is recorded as magnetic field is swept at fixed temperature and angle. For wiring, reversal, heating, contact, and geometric checks, use Transport Measurements. Quantum-oscillation analysis begins only after those checks establish which resistance or resistivity tensor component was measured.
Resistivity is not conductivity
Section titled “Resistivity is not conductivity”The oscillatory density of states enters conductivity, while an experiment often records resistivity. For an isotropic in-plane tensor under one common sign convention,
When , an oscillatory increase in can correspond to a decrease in . In a high-mobility regime with , the relation changes again. Parallel channels and anisotropy add further mixing.
Consequently, assigning integer Landau indices to maxima or minima of raw by a memorized rule is unsafe. First reduce the terminal data, remove longitudinal or transverse admixture as appropriate, convert the tensor under a declared convention, and derive which extrema the chosen model associates with integer filling.
Acquire longitudinal and transverse data over the same field, angle, and temperature intervals. Check several current amplitudes and sweep rates, and keep up- and downsweeps separate until heating, hysteresis, and instrumental lag are excluded. Repeat the same field window at each temperature used for a mass fit.
Pulsed-field measurements can reach the cleanest quantum regime while introducing eddy-current heating, magnetocaloric temperature changes, inductive pickup, mechanical vibration, and phase lag from finite lock-in or digitizer bandwidth. Agreement between rising and falling field branches is an important diagnostic, not a cosmetic overlay.
de Haas–van Alphen Measurements
Section titled “de Haas–van Alphen Measurements”The de Haas–van Alphen effect is an oscillation of magnetization or magnetic susceptibility. If denotes the oscillatory grand-potential density, the magnetization is
For an extensive grand potential, the derivative instead gives the total magnetic moment. At fixed particle number, use the Helmholtz free energy and allow the chemical potential to change with field; chemical-potential oscillations can matter particularly in two dimensions.
Magnetization can be measured with induction coils, SQUID magnetometry, force magnetometry, or a cantilever. In torque magnetometry, the sample magnetic moment produces
Torque is particularly sensitive to magnetic anisotropy and can be excellent for small crystals. It can also vanish at a high-symmetry orientation even when magnetization oscillations remain finite. The cantilever response must be calibrated, and magnetic torque can rotate a compliant sample enough to make the actual angle field dependent.
Because de Haas–van Alphen oscillations derive from a thermodynamic potential, they avoid some conductivity-tensor ambiguities of Shubnikov–de Haas data. They do not avoid thermal damping, disorder damping, spin zeros, magnetic interaction, chemical-potential oscillation, or orbit assignment. Shoenberg (1984) treats these thermodynamic and experimental distinctions in detail.
From a field trace to a spectrum
Section titled “From a field trace to a spectrum”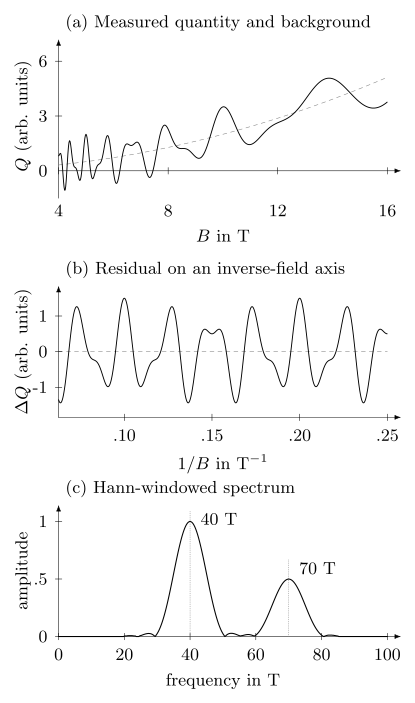
All three panels describe the same synthetic record: , with entered in tesla and in arbitrary units. Subtracting the quadratic background gives two oscillations periodic in . The bottom panel is the magnitude of their Hann-windowed transform on , multiplied by for window . This normalization recovers the amplitude of a well-isolated cosine when leakage from its negative-frequency partner is negligible. The finite width of each peak comes from the window. Constant amplitudes are chosen to isolate the analysis steps; real records also have thermal and field-dependent damping.
Background removal
Section titled “Background removal”Write the measured channel as
may be estimated by a low-order polynomial, spline, physically motivated smooth model, or low-pass procedure. No method is neutral. An overly flexible background can absorb low-frequency oscillations; an overly rigid one leaves curvature that appears as spectral weight near zero frequency. A robust analysis repeats the extraction across reasonable background families and reports which peaks and phases survive.
Never discard the raw trace. Publish or archive the background function, its parameters, the exact fit interval, masked regions, and the residual before and after any filtering. A Fourier spectrum alone does not let another reader reconstruct the analysis.
Uniform inverse-field sampling
Section titled “Uniform inverse-field sampling”Oscillations of one ideal orbit take the schematic form
Define . Data acquired uniformly in are nonuniform in and should be interpolated or analyzed with a method that handles nonuniform samples. Interpolation should not invent resolution; its grid spacing only needs to support the highest retained frequency under a documented sampling criterion.
For a field interval , the inverse-field span is
The characteristic Fourier peak-width scale is
Window functions reduce spectral leakage at the price of broadening peaks and changing amplitude normalization. Zero-padding makes a plotted spectrum smoother but does not increase the measured information or narrow the window response. A specified parametric signal model can sometimes distinguish closer frequencies at high signal-to-noise ratio, but that inference relies on the model and is not resolution gained from zero-padding.
For a reproducible transform, state the field interval, excluded points, background, interpolation, window, and amplitude normalization. Repeat plausible background and interval choices, and compare a direct fit to the residual when peaks overlap. This also tests whether processing has created the feature being interpreted.
A moving-window transform can reveal field-dependent frequencies, but its frequency and field resolutions trade against each other. Apparent peak drift can also arise from beating, amplitude modulation, changing background, or a short window.
Lifshitz–Kosevich damping
Section titled “Lifshitz–Kosevich damping”In the Lifshitz–Kosevich treatment of well-defined quasiparticle orbits, a useful schematic form for harmonic is
with
, the field power , and the phase depend on dimensionality, observable, orbit curvature, and convention. The in damping factors is positive: . The absolute value matters for a hole pocket. The Fermi Surface page explains this area derivative, and Effective Mass compares it with other masses. The thermal factor applies in both common two- and three-dimensional semiclassical settings, but the prefactors and oscillations of chemical potential need separate treatment. It is not a universal waveform for arbitrary strongly correlated states.
Cyclotron mass from temperature damping
Section titled “Cyclotron mass from temperature damping”At fixed orbit, angle, and field window, fit the temperature dependence to . Fourier amplitudes average a field-dependent signal over the window. A common approximation evaluates at the midpoint in inverse field,
That approximation should be tested by integrating the modeled field dependence through the actual background, interpolation, and window pipeline. Reusing different field windows at different temperatures can bias the fitted mass. So can an unresolved doublet whose components have different masses.
The measured positive is set by the magnitude of the energy derivative of the orbit area. It need not equal a local band-curvature mass, an optical mass, or a thermodynamic density-of-states mass. In an interacting metal, it includes quasiparticle renormalization along that orbit.
Dingle damping and quantum lifetime
Section titled “Dingle damping and quantum lifetime”For Lorentzian level broadening with half-width , Dingle’s exponential factor can be written using
A different line shape or inhomogeneous density distribution can produce a different field dependence. After dividing out the known thermal and field prefactors, a Dingle plot tests exponential damping versus . Curvature in that plot can indicate field-dependent scattering, unresolved frequencies, magnetic breakdown, spin interference, an incorrect field prefactor, or failure of the assumed background. A fitted straight line is meaningful only if these alternatives are constrained.
The corresponding quantum mobility scale is
It is not generally the Hall or transport mobility. Reporting all three as interchangeable obscures real information about scattering.
Spin damping
Section titled “Spin damping”For a simple orbit with an effective factor and negligible complications, the spin reduction factor is often written
A zero of can suppress the fundamental and make a harmonic appear dominant. In tilted, spin–orbit-coupled, magnetic, or multiband systems, both and can depend on angle and field, and the scalar formula may be inadequate. An absent frequency at one angle is therefore not proof that the orbit disappears.
Angular dependence and Fermi-surface geometry
Section titled “Angular dependence and Fermi-surface geometry”Rotate the field relative to crystallographic axes and track each peak continuously. For an ideal cylindrical Fermi surface, or a strictly two-dimensional sheet responding only to the perpendicular orbital field,
where is measured from the cylinder axis. Deviations can reveal warping, a closed three-dimensional pocket, reconstruction, or a mistaken angle zero. Near , small alignment errors are amplified. The formal divergence does not predict an accessible infinitely large orbit: a strict two-dimensional sheet loses orbital quantization when the perpendicular field vanishes, while warping or finite thickness invalidates the ideal model.
Three-dimensional pockets generally produce several extremal branches whose frequencies can merge, split, or exchange amplitude with angle. Branch tracking should use frequency, mass, amplitude, and continuity together. Assigning each isolated peak independently at every angle can create artificial discontinuities.
Torque amplitude also contains an angular derivative of the orbit frequency. A branch can become weak where is small, even though the orbit remains present. Comparing torque, magnetization, and transport prevents detector-specific zeros from being mistaken for topological changes.
Fermi-surface reconstruction
Section titled “Fermi-surface reconstruction”Translation-symmetry breaking with wavevector folds bands into a reduced Brillouin zone. Hybridization at crossings can replace a large unreconstructed surface with smaller electron and hole pockets. Quantum oscillations can then reveal new frequencies and masses that are difficult to infer from smooth transport alone.
The strongest reconstruction case combines:
- a thermodynamic or diffraction signature of the ordering wavevector;
- frequency changes across the same control parameter;
- angle dependence consistent with reconstructed pockets;
- carrier-sign or compensation constraints from Hall and thermoelectric response;
- a band-folding calculation using the observed symmetry and order;
- accounting for all required degeneracies and plausible unobserved heavy pockets.
Small frequencies alone do not identify the order responsible for them. They can arise from an unreconstructed small pocket, surface states, bilayer splitting, warping, or a minority phase.
Magnetic breakdown and combination frequencies
Section titled “Magnetic breakdown and combination frequencies”At high field, a quasiparticle can tunnel across a small momentum-space gap between neighboring semiclassical orbits. A common leading probability has the form
where depends on the local gap and velocities. Breakdown can generate large composite orbits, sum and difference frequencies, and field-dependent redistribution of amplitude. Harmonics, chemical-potential oscillations, and nonlinear mixing can generate related spectral structures without corresponding to independent pockets.
Before counting every Fourier peak as a Fermi-surface sheet, test frequency arithmetic, harmonic mass scaling, field dependence, and the expected breakdown network. Conversely, a reconstructed pocket can be invisible because it is heavy or strongly scattered. Luttinger counting from observed frequencies is incomplete until missing sheets and degeneracies are bounded.
Berry phase and Landau-fan interpretation
Section titled “Berry phase and Landau-fan interpretation”For one isolated nondegenerate orbit in the simplest semiclassical limit,
so the Berry phase shifts the orbit quantization (Mikitik and Sharlai, 1999). This elegant relation motivates phase analysis, but the phase measured in an oscillatory observable generally also contains:
- a stationary-phase correction from integrating over the direction along the field, commonly of a cycle for simple three-dimensional extremal orbits (a phase ), and in the ideal two-dimensional limit;
- Zeeman splitting and spin-dependent amplitude reversals;
- orbital magnetic-moment corrections;
- observable-dependent derivatives and conductivity-tensor inversion;
- warping, magnetic breakdown, and chemical-potential oscillations;
- multiple close frequencies or unresolved harmonics;
- a convention-dependent choice of which maxima or minima receive integer indices.
Alexandradinata et al. (2018) combine geometric phase, orbital moment, and spin transport around the orbit; Taskin and Ando (2011) show how nonideal Dirac dispersion affects the interpretation. A fitted fundamental phase is therefore not generally a direct Berry phase, and a near- value is not by itself a unique signature of a Dirac or Weyl band.
Landau-fan construction
Section titled “Landau-fan construction”A Landau fan plots assigned index against for selected extrema and fits a line. A defensible fan requires:
- deriving the extrema-to-index rule for the measured observable and tensor regime;
- tracking one orbit without switching branches;
- resolving spin splitting or modeling it;
- using enough periods that slope and intercept are not strongly covariant;
- propagating uncertainty in field, extrema location, and index assignment;
- testing the fit against the full oscillatory waveform.
Extrapolating an intercept from only a few high-field levels is especially fragile. Shifting every assigned index by the same integer leaves the fitted frequency exactly unchanged and shifts the intercept by an integer; this is the same physical phase modulo a full cycle. Confusing maxima with minima instead shifts the inferred phase by half a cycle, and missing a level only partway through a sequence can distort the frequency too. Background choices can move broad extrema, while unresolved beating can shift them nonuniformly. The safer hierarchy is: determine frequency and orbit geometry first, constrain dimensional and spin corrections independently, then fit the complete field-domain signal under competing phase models.
Uncertainty and reproducibility
Section titled “Uncertainty and reproducibility”A quantum-oscillation uncertainty budget should separate experimental, processing, and model contributions.
| Contribution | Examples | Useful checks |
|---|---|---|
| field coordinate | calibration, hysteresis, pulse timing | reference probe, both sweep directions |
| temperature | thermometer lag, eddy heating, magnetocaloric response | current and sweep-rate series, pulse-branch comparison |
| angle | mount offset, backlash, field-induced rotation | symmetry orientations, bidirectional rotation |
| raw observable | contact mixing, cantilever calibration, lock-in phase | lead reversal, calibration standard, bandwidth test |
| background | polynomial order, spline knots, mask boundaries | alternate backgrounds, synthetic-signal recovery |
| transform | interpolation, window, normalization, finite span | neighboring windows, time-domain fit |
| orbit model | dimension, harmonics, spin, breakdown, chemical potential | competing fits, angle and temperature dependence |
The uncertainty framework in JCGM 100:2008 is useful here. Parameter covariance matters. Frequency and phase correlate over a short inverse-field window; mass correlates with the chosen effective field; Dingle temperature correlates with the field prefactor and background; two nearby amplitudes correlate below the transform resolution. Report confidence regions or covariance matrices when these parameters support a physical claim.
A reusable data release includes raw signed traces, calibration metadata, thermometer and angle records, processing code, background alternatives, masks, transform conventions, fit residuals, and machine-readable parameter tables. Plot images are not a substitute for the underlying traces.
Exercises
Section titled “Exercises”1. Orbit area and circular wavevector
Section titled “1. Orbit area and circular wavevector”A fundamental frequency is . Find the extremal area in and . If the cross section is circular, estimate . Use and .
Solution
The Onsager relation gives
For a circular orbit,
The frequency determines an extremal cross section. Circularity and the assignment to a particular pocket are additional assumptions.
2. Finite-window resolution
Section titled “2. Finite-window resolution”Data are analyzed from to . Estimate the Fourier resolution. Can this window cleanly resolve peaks at and ? Would zero-padding settle the question?
Solution
The inverse-field span is
Thus
The proposed peaks are separated by only , below this characteristic resolution. Their sum can produce a broadened or window-dependent feature, so two cleanly separated Fourier peaks are not expected. A constrained two-frequency fit would require additional model and uncertainty checks. Zero-padding only interpolates the discrete spectrum; it cannot add the missing inverse-field span.
3. Thermal damping
Section titled “3. Thermal damping”For and , calculate the fundamental at and .
Solution
Using ,
The amplitude falls by more than a factor of two. A mass fit should use all temperatures and propagate the uncertainty in field-window averaging rather than infer from one ratio.
4. Dingle scale and quantum mobility
Section titled “4. Dingle scale and quantum mobility”An orbit has and . Find at , , and . Use .
Solution
For the fundamental,
The lifetime is
Therefore
This is a quantum mobility inferred from level broadening. It need not match a transport or Hall mobility.
5. Angular test of a cylinder
Section titled “5. Angular test of a cylinder”A quasi-two-dimensional orbit has . What does an ideal cylindrical model predict at ? The measured branch is instead . Name three possible interpretations.
Solution
For an ideal cylinder,
The lower observed frequency could reflect Fermi-surface warping or a closed three-dimensional pocket, an angle-zero or sample-alignment error, or incorrect tracking of the branch. Reconstruction and field-dependent band structure are further possibilities. A single angle cannot distinguish them; follow the branch continuously and compare with a geometric model and an independent angle calibration.
6. The same fan intercept from two phases
Section titled “6. The same fan intercept from two phases”Consider an ideal two-dimensional signal
Assume all other phase corrections vanish. Compare its maxima for (a) and , and (b) and . Can their fan intercepts distinguish the Berry phases? What does adding one to every index change?
Solution
In (a), and . In (b), and the signal is the same cosine. Both have maxima at equal to an integer, so their intercepts agree modulo one. An unrecognized negative spin factor can imitate the half-cycle change attributed to a Berry phase. Temperature, angle, and resolved spin structure can help determine which model applies.
Adding one to every index changes the plotted intercept by one but leaves the frequency and physical phase modulo unchanged. Swapping maxima and minima changes the phase by . Neither an absolute integer label nor an intercept alone removes the need to identify the measured observable and its spin and dimensional corrections.
References
Section titled “References”- A. Alexandradinata, C. Wang, W. Duan, and L. Glazman, “Revealing the Topology of Fermi-Surface Wave Functions from Magnetic Quantum Oscillations”, Physical Review X 8, 011027 (2018).
- R. B. Dingle, “Some Magnetic Properties of Metals. II. The Influence of Collisions on the Magnetic Behaviour of Large Systems”, Proceedings of the Royal Society A 211, 517–525 (1952).
- Joint Committee for Guides in Metrology, Evaluation of Measurement Data: Guide to the Expression of Uncertainty in Measurement, JCGM 100:2008.
- I. M. Lifshitz and A. M. Kosevich, “Theory of Magnetic Susceptibility in Metals at Low Temperatures”, Soviet Physics JETP 2, 636–645 (1956).
- G. P. Mikitik and Yu. V. Sharlai, “Manifestation of Berry’s Phase in Metal Physics”, Physical Review Letters 82, 2147–2150 (1999).
- L. Onsager, “Interpretation of the de Haas–van Alphen Effect”, Philosophical Magazine 43, 1006–1008 (1952).
- D. Shoenberg, Magnetic Oscillations in Metals, Cambridge University Press (1984).
- A. A. Taskin and Y. Ando, “Berry Phase of Nonideal Dirac Fermions in Topological Insulators”, Physical Review B 84, 035301 (2011).