

Data Interpretation and Pitfalls
A resistance minimum, spectral peak or hysteresis loop can be reproducible while its proposed microscopic explanation is wrong. Interpretation asks which physical models can produce the measured signal, and which further measurement would distinguish them. Here we compare common ambiguities in quantum-material experiments: depth sensitivity, sample variation, spatial mixtures, contacts and nonequilibrium response. The aim is to learn more from a feature without claiming more than the experiment determines.
Required background. How Quantum Matter Is Measured supplies the forward-model distinction between a detector record and a material claim. Transport Measurements supplies contact, geometry and excitation artifacts as concrete alternatives. Disorder in Quantum Matter supplies spatial variation, scattering and sample-averaging mechanisms that can imitate intrinsic material signatures.
Competing explanations for a measured signal
Section titled “Competing explanations for a measured signal”Begin with a concrete distinction: measuring a gate-dependent resistance establishes that the device responds to its gate, but does not yet identify whether carrier density, contact transparency or trapped charge caused the change. The probe-specific forward models are developed in How Quantum Matter Is Measured and the individual experiment pages. Here we use them to compare explanations.
An association admits several causal structures
Section titled “An association admits several causal structures”Suppose a measured feature changes with a control parameter . The association can arise because:
- directly changes the proposed microscopic variable;
- changes a common cause that affects both the proposed variable and ;
- the apparatus or sample preparation changes with ;
- the analysis selects, aligns, normalizes, or thresholds data in a -dependent way;
- several mechanisms coexist and happen to vary together over the measured range;
- a third variable, such as temperature, strain, carrier density, domain fraction, or contact transparency, was not held fixed.
For example, a gate voltage can change band filling, electric field, contact resistance, dielectric loss, trap occupation, and local heating. A pressure sweep can change lattice constants, contact geometry, pressure gradients, and thermometer calibration. Correlation between a feature and the nominal control is therefore evidence of control dependence, not yet proof of one microscopic pathway.
A useful notation makes the alternatives explicit. Under candidate model ,
where contains the physical parameters of interest and contains nuisance parameters such as gain, background, temperature offset, contact asymmetry, phase fraction, or resolution. Distinct pairs may predict nearly the same measured record. That is a problem of model non-identifiability, not merely large statistical noise.
Fit quality is not mechanism identification
Section titled “Fit quality is not mechanism identification”With residual vector and data covariance matrix , a common diagnostic is
For a specified positive-definite covariance, measures the residual size in units of the assumed fluctuations. Its minimum is typically of order for a correct linear Gaussian model with observations and identifiable fitted coefficients; nonlinear fits need additional care. An unusually small value can indicate overestimated errors, excessive flexibility or neglected correlations, rather than an exceptionally good physical explanation. It does not show that:
- the covariance model is correct;
- the residuals are structureless;
- the fitted parameters are identifiable;
- the model predicts data outside the fit region;
- a competing mechanism fits less well;
- the experiment intervened on the variable named in the causal explanation.
Information criteria make one limited comparison between fit and complexity. Under the regular large-sample assumptions behind AIC, for a model with independently adjusted parameters (including fitted noise parameters) and maximized likelihood , the Akaike information criterion is
Only differences among models fitted to the same observations and likelihood convention are meaningful. Comparing unadjusted likelihoods for differently transformed data is invalid; small samples, parameter boundaries and nonidentifiable mixtures can invalidate the usual correction. A lower AIC is not a posterior probability that a mechanism is true, and no criterion rescues a comparison that omitted the physically relevant alternative. Bayesian model checks, cross-validation, likelihood-ratio methods, and information criteria answer different questions and require their own assumptions.
Inspect parameter uncertainty as well as a best fit. Let collect both physical and fitted nuisance parameters. If the Jacobian
has nearly dependent columns after weighting by the measurement covariance and physically meaningful parameter scales, several parameter combinations move the prediction in almost the same direction. Full local rank does not exclude separate, globally indistinguishable solutions. More significant digits in the optimizer output do not add information. Extend the range, change the probe, or constrain a nuisance parameter independently.
Choose a measurement that separates the predictions
Section titled “Choose a measurement that separates the predictions”Consider sheet conductances of and at thicknesses and . Two positive-conductance models fit both exactly:
Model A describes a constant sheet contribution in parallel with a bulk of constant conductivity. Model B has no separate sheet channel: its bulk conductivity varies with thickness, . This is an illustrative alternative over the measured range, not an asserted microscopic law. At the predictions are and . A third specimen can distinguish them only if thickness, calibration and specimen variation are sufficiently well controlled. Repeating the original two measurements more precisely cannot separate these exact predictions.
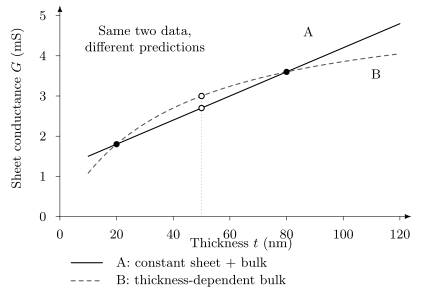
The filled points are the two illustrative observations. Both curves pass through them. The open points show the different predictions at ; their separation is . The plotted range is finite: extrapolating either curve to a vanishing film is not a physical prediction.
The same principle motivates field-angle scans, isotope substitution, contact permutations and independent probes: choose conditions under which plausible mechanisms predict different signs, scalings or locations. Such controls also change other variables, so measure those changes. A second probe can share a calibration or sample artifact with the first; agreement is strongest when their principal ambiguities differ.
Surface and bulk contributions
Section titled “Surface and bulk contributions”Depth weighting has a range of validity
Section titled “Depth weighting has a range of validity”For an incoherent signal that is linear in a local response, depth sensitivity can be represented by a kernel. At probe setting ,
where is the local response, includes attenuation and geometry, and is the specimen thickness. This representation is not universal: coherent scattering adds amplitudes before squaring, and nonlocal transport requires a current-distribution calculation. In the thick-sample, single-exponential approximation,
The fraction originating in a surface-modified layer of thickness is then
For a finite film with , normalize by the signal from the whole film instead:
The thick-sample expression follows when ; when , the fraction approaches . Changing information depth can separate local responses, but only if the relative sensitivity to them is known. Elastic scattering, emission angle, matrix elements and interfaces modify this model. An effective attenuation length is not automatically the inelastic mean free path or the information depth; Powell and Jablonski distinguish these quantities. Treat the chosen kernel and its uncertainty explicitly.
A surface can reconstruct, oxidize, adsorb residual gas, bend bands, lose a protecting symmetry, change stoichiometry, or host a distinct ordered phase. Conversely, a genuine topological surface state is supposed to differ from the bulk. Surface–bulk disagreement is therefore physical information, not automatically a bad sample.
Extensive and sheet responses scale differently
Section titled “Extensive and sheet responses scale differently”Thickness variation can separate some parallel contributions. If two surfaces contribute sheet conductances and while a homogeneous bulk has conductivity , then
An intercept in versus is consistent with thickness-independent channels, but it is not uniquely topological. Accumulation layers, damaged surfaces, edge conduction, cracks, and thickness-dependent mobility can produce departures from simple bulk scaling. The comparison is strongest when thickness, width, contact geometry, strain, composition, and fabrication history are independently measured.
For an extensive thermodynamic observable , a surface excess often scales as area while the bulk term scales as volume,
Surface spectroscopy and bulk thermodynamics should not be forced to show identical amplitudes. Instead ask whether one depth-dependent model can account for both, including their normalization and detection limits.
Surface and bulk measurements need not have identical amplitudes. Compare their normalizations and detection limits, repeat cleaves or positions, and vary calibrated probe depth or thickness. Photoemission and tunneling spectroscopy explain their different sampling mechanisms.
Replication and selection
Section titled “Replication and selection”Repeated scans are not independent specimens
Section titled “Repeated scans are not independent specimens”Experimental variation occurs at several levels: synthesis batch, crystal or film, fabricated device, contact configuration, spatial position, thermal cycle, cooldown, and repeated acquisition. Ten scans on one spot characterize repeatability of that spot; they do not establish sample-to-sample reproducibility.
A hierarchical description makes this distinction visible. For batch , specimen , cooldown , and repeat , write
This additive model separates batch, specimen, cooldown and acquisition variation. Gaussian distributions are not essential, but additivity and any assumed independence are modeling choices; interactions or systematic drift require a richer model. Averaging all records as though they were independent underestimates uncertainty when batch or specimen effects dominate.
Sample dependence can be scientifically meaningful. Carrier density may track vacancy concentration; strain may stabilize one structural domain; disorder may tune a transition; interface termination may control proximity coupling. The correct response is not to hide the dependence but to identify and measure the covariate.
Selection can bias the apparent physics
Section titled “Selection can bias the apparent physics”Selection enters when:
- only samples with a visible transition are measured further;
- only the cleanest spatial region is shown;
- failed devices disappear from the denominator;
- a fitting window is chosen after seeing where a desired exponent appears;
- one field or gate range is emphasized because it resembles a target theory;
- specimens are excluded without a predeclared quality criterion.
This does not make the retained data false. It changes the population to which the result applies. Report how the measured set was chosen: number synthesized, characterized, fabricated, cooled, electrically functional, analyzed, and displayed. Device Fabrication Concepts shows how fabrication yield and independent replication enter a device comparison.
As a simple selection example, 20 independent null tests, each with a 5% false-positive probability, give probability of at least one positive result. Overlapping fit windows are generally correlated, so this number is illustrative, not a universal correction. Repeating the complete selection procedure in a simulation or testing a new specimen helps assess such choices. For a material claim, report distributions or specimen-resolved values rather than only the best trace. A median and range may be more informative than a standard error when the distribution is skewed or multimodal. If batches differ systematically, a grand mean can describe no actual specimen.
Spatial mixtures and connectivity
Section titled “Spatial mixtures and connectivity”A spatial average need not resemble any local region
Section titled “A spatial average need not resemble any local region”For a probe linear in local response, a two-phase mixture can have
Even this relation requires the correct weights: volume, mass, illuminated area, penetration depth, form factor, or detector acceptance. Many observables are not linear mixtures. Transport depends on connectivity; diffraction intensity can contain coherent amplitudes; magnetic response includes demagnetizing fields; spectra can exchange weight under convolution and background subtraction.
For quasistatic scalar conduction with statistically isotropic spherical inclusions (circular in two dimensions), the symmetric Bruggeman approximation in dimensions relates local conductivities with volume fractions by
This is a model, not a universal mixing law. Series layers, parallel stripes, random networks, filamentary paths, and percolation near a connectivity threshold produce different effective responses. A connected superconducting filament can short a transport path while its heat-capacity anomaly is too small to resolve. Magnetic shielding needs a separate geometry calculation: even a thin connected shell can screen a much larger interior, so shielding fraction is not automatically superconducting volume fraction. Conversely, disconnected superconducting islands can affect local spectroscopy without giving zero resistance.
Distributed transition scales broaden sharp local physics
Section titled “Distributed transition scales broaden sharp local physics”If local regions have transition parameter drawn from , a bulk signal may be
A rounded anomaly can therefore arise from an intrinsically broad crossover, finite resolution, finite-size effects, or a distribution of locally sharp transitions. Fitting the rounded curve to one intrinsic linewidth assigns all broadening to the wrong layer of the model.
Compare spatial maps with bulk averages, vary spot size or depth, and test contact configurations that change the current paths. Disorder in Quantum Matter develops disorder statistics; Competing Orders distinguishes microscopic coexistence from phase separation.
Contacts and heating
Section titled “Contacts and heating”Four terminals remove a voltage drop, not every contact effect
Section titled “Four terminals remove a voltage drop, not every contact effect”An ideal four-terminal measurement suppresses series voltage drops in high-impedance sense leads. It does not guarantee uniform current, an unmodified channel, negligible heating, or noninvasive reservoirs. Contacts can:
- form Schottky barriers or tunnel barriers;
- locally dope, screen, strain, alloy, oxidize, or damage the material;
- short an edge or one layer of a heterostructure;
- inject nonequilibrium carriers or spin;
- crowd current into a narrow region;
- change transparency with field, gate, pressure, or temperature;
- act as heat leaks or thermal bottlenecks.
In an anisotropic conductor, imperfect current injection can produce current jetting. The measured voltage then depends strongly on contact placement because the electric potential is not the one-dimensional profile assumed in converting voltage to resistivity. A negative longitudinal magnetoresistance can even be generated or exaggerated by this geometry, so its observation alone does not establish a chiral anomaly.
The measured terminal relation should be kept explicit:
If changes far more than expected when nominally equivalent current or voltage contacts are exchanged, the spatial current distribution is part of the observable. Finite-element modeling can help, but only when sample shape, anisotropic conductivity, and contact geometry are measured rather than tuned until the desired curve appears.
Heating can imitate thresholds and gaps
Section titled “Heating can imitate thresholds and gaps”Electrical power is dissipated somewhere in the device and its environment. In a simple electron–phonon cooling model,
where , , and the active volume are material and regime dependent. Here must mean the power deposited in the modeled electronic volume, and the electronic distribution must be close enough to thermal for to be meaningful. Total circuit power can instead be dissipated in contacts or reservoirs; a nonthermal distribution need not have one electron temperature. The equation shows why a cryostat thermometer alone is insufficient. A current-dependent transition, rounded gap, nonlinear conductance, or apparent critical field should be checked against power, pulse duration, duty cycle, filtering, and an independent thermometer when possible.
Current reversal separates offsets; several terminal configurations reveal spatial effects; power, pulse-length and duty-cycle scans test heating. In linear response, reciprocity compares exchanged terminals with magnetic field and other time-reversal-odd variables reversed. A failure to prepare the reversed magnetic state is not by itself a reciprocity violation. Transport Measurements explains these reductions, while Device Fabrication Concepts treats contact-induced modification and heat flow.
What a topological signature establishes
Section titled “What a topological signature establishes”Topology concerns a stated class of states or Hamiltonians, its allowed deformations and any protecting symmetries. In a gapped phase, an invariant can constrain boundaries or quantized responses under additional conditions; a gapless semimetal instead uses topology around its nodes. Neither a gapless boundary nor a measured closing and reopening of a spectral gap is a universal requirement for identifying every topological phase. Some boundaries can be gapped, and a mobility gap can remain meaningful without a clean spectral gap.
The practical question is which predictions follow for the particular symmetry class, occupied states, probe and boundary. Topology in Quantum Matter develops these distinctions. The following comparisons illustrate why a visually distinctive feature rarely settles them:
| Observation | Important alternatives | Useful additional measurement |
|---|---|---|
| Band inversion in a calculation or spectrum | Incorrect structure, correlation shift, ordinary avoided crossing, surface band bending | Measured structure, symmetry labels, gap evolution, invariant calculation tied to experiment |
| Boundary-localized or Dirac-like state | Dangling-bond state, reconstruction, accumulation layer, trivial resonance | Bulk gap, connectivity, spin or symmetry texture, termination and thickness controls |
| Edge-dominated conduction | Trivial accumulation edge, cracks, damaged perimeter, current crowding | Nonlocal geometry, width and length scaling, gate control, quantized response under stated conditions |
| Negative longitudinal magnetoresistance | Current jetting, weak localization, magnetic scattering, conductivity-tensor mixing | Contact and angle controls, geometry modeling, complementary Weyl-node and anomaly diagnostics |
| Zero-bias conductance peak | Andreev bound state, quantum dot, Kondo feature, disorder, heating, soft gap | Nonlocal spectroscopy, gap evolution and both-end correlations; fusion and braiding test further properties |
| Hall-like plateau or fractional value | Parallel channels, contact mixing, inhomogeneous filling, nonequilibrium domains | Metrological precision, vanishing longitudinal response, tensor consistency, edge and bulk tests |
No row defines a universal checklist. A Chern insulator, Weyl semimetal, topological superconductor, and fractional topological phase require different decisive tests. The common error is to substitute one visually suggestive feature for the entire chain.
A response compatible with topology, an identified phase and a demonstrated protected operation are different results. Report which one was measured and which alternatives remain. Pan and Das Sarma, and the review by Prada and colleagues, explain how topologically trivial Andreev states can mimic zero-bias peaks. A fusion or braiding experiment asks an additional question about non-Abelian behavior; it is not a prerequisite for every spectroscopic claim or a consequence of a peak alone.
Hysteresis and relaxation
Section titled “Hysteresis and relaxation”Hysteresis establishes memory, not its microscopic origin
Section titled “Hysteresis establishes memory, not its microscopic origin”If upward and downward sweeps differ at the same nominal control value, the measured state depends on history. Possible causes include:
- long-lived metastable states near an equilibrium first-order transition;
- domain-wall, vortex, charge, or defect pinning;
- glassy relaxation or broad barrier distributions;
- finite-rate lag of an otherwise single-valued equilibrium response;
- thermal lag, eddy-current heating, or magnetocaloric effects;
- trapped charge, dielectric relaxation, adsorbate motion, or contact rearrangement;
- irreversible sample damage or chemical change;
- controller, magnet, piezoelectric, or sensor hysteresis.
A minimal relaxation model already creates a sweep-rate-dependent lag. Let an internal variable relax toward :
For a slow linear ramp , the leading lag is
Reversing reverses this offset and creates a loop even when the equilibrium relation is single valued. If the loop shrinks toward zero as and stabilized point measurements approach one curve, finite-rate lag is favored. A rate-independent loop over an accessible window may reflect metastability or pinning, but an inaccessible longer relaxation time remains an alternative.
When loop area represents work
Section titled “When loop area represents work”For a generalized coordinate and conjugate response , a cyclic work or dissipation can sometimes be written
The physical meaning depends on signs, units, controlled variables, and whether is truly conjugate to . The area of an arbitrary plotted loop is not automatically dissipated energy. Backgrounds, axes, rate, and instrument phase can all change it.
Compare sweep direction and rate, stabilized steps and waiting-time relaxation while monitoring the sample temperature. State how the initial state was prepared and whether cycling changes the sample. Do not average opposite branches before checking that they represent the same state. A slowly relaxing system can appear rate independent over an accessible window; conversely, a reversible trace does not rule out an equilibrium transition. Magnetic Susceptibility gives an explicit dynamical response and its relation to absorbed work.
Exercises
Section titled “Exercises”1. Separate surface and bulk conductance
Section titled “1. Separate surface and bulk conductance”Two flakes of the same material have thicknesses and . Their measured sheet conductances are and . Assume
with identical top and bottom surface conductances . Find and . Predict for . Then test the alternative with no separate sheet channel: find from the same two observations and predict its value at . Does either fit identify a mechanism?
Solution
The slope gives
The zero-thickness intercept is
so each surface contributes . At ,
For the alternative, equality of at the two thicknesses gives
The intercept in Model A is conditional on constant bulk conductivity and thickness-independent channels. Model B fits the same data with a thickness-dependent bulk conductivity. Neither fit proves a microscopic mechanism or topology; a third thickness and independent material characterization would test the assumptions.
2. Compare two information depths
Section titled “2. Compare two information depths”A reconstructed surface layer is thick. For normalized exponential depth weighting, compute the surface fraction for and . Why does comparing the two settings help?
Solution
Using ,
The first setting is dominated by the reconstructed layer, while the second gives much greater relative weight to deeper material. A feature that scales with these fractions supports a near-surface assignment. The test remains model dependent because matrix elements, elastic scattering, and the depth profile may also change between settings.
3. Show why phase fractions do not determine transport
Section titled “3. Show why phase fractions do not determine transport”A composite contains fraction of phase with and fraction of phase with . Compute the effective conductivity for ideal parallel stripes and ideal series layers.
Solution
For stripes parallel to current,
For layers in series,
The same fractions and local conductivities differ by more than an order of magnitude because connectivity differs. A phase fraction from diffraction cannot be converted into transport without a geometry or network model.
4. Interpret contact-dependent magnetoresistance
Section titled “4. Interpret contact-dependent magnetoresistance”At high field, two nominally longitudinal voltage pairs on the same anisotropic crystal give resistance changes of and under the same current contacts. Exchanging the current contacts changes the first result to . What can be concluded, and what should be done next?
Solution
The experiment has established strongly configuration-dependent terminal resistances. It has not established a unique intrinsic longitudinal resistivity. The sign and magnitude changes are evidence that current distribution, contact geometry, tensor mixing, or inhomogeneity matter.
Next steps include mapping all available terminal configurations, imaging the exact geometry, measuring field-angle and current dependence, checking reciprocity in linear response with field and magnetic order appropriately reversed, and solving the anisotropic potential problem with measured contacts and dimensions. A chiral-anomaly interpretation should remain at most a candidate until current jetting and other magnetoresistance mechanisms are quantitatively bounded.
5. Derive a sweep-rate lag
Section titled “5. Derive a sweep-rate lag”Let and . In the slow-ramp limit of
find the lag from equilibrium and the separation between equal-magnitude upward and downward ramps at the same .
Solution
For this linear equilibrium curve and constant , the steady-ramp particular solution is exact; the initial transient decays as . After that transient,
Thus the lag is
For upward and downward ramps with rates and ,
The magnitude of the branch separation is and vanishes linearly with sweep rate away from the reversal transients. A rate-dependent loop therefore need not imply an equilibrium first-order transition.
6. Interpret an information-criterion comparison
Section titled “6. Interpret an information-criterion comparison”Model has fitted parameters and . Model has and . Compute both AIC values. Is either mechanism proved?
Solution
The values are
Model has the lower AIC by , so it has modest support relative to within this candidate set and likelihood model. Neither mechanism is proved. The comparison does not include unconsidered alternatives, validate the noise model, establish causal direction, or test prediction outside the fitted data. Residual structure and held-out measurements could reverse the practical preference.
7. Calibrate a topological claim
Section titled “7. Calibrate a topological claim”A nanowire device shows a zero-bias conductance peak over a finite field interval. The peak appears only at one end, the induced gap softens with field, and no bulk-gap closing or reopening is resolved. Write the strongest justified claim and propose three discriminating tests.
Solution
The strongest justified statement is: the device has a local zero-bias feature compatible with several subgap mechanisms. The data do not establish a bulk topological phase or a nonlocal Majorana mode. Ordinary Andreev bound states, a quantum dot, disorder, dissipation, and heating remain viable.
Discriminating tests include:
- simultaneous spectroscopy from both ends and a middle or bulk-sensitive terminal;
- calibrated tracking of the induced bulk gap through the proposed transition, including field-angle and gate dependence;
- replication across device length, barrier settings, contacts, and independently characterized disorder.
Fusion or braid-order protocols would test additional predictions about non-Abelian behavior. Their outcomes cannot be inferred from a local peak. An unresolved gap closing does not independently exclude topology, since resolution, spatial sampling and selection rules matter; the stated measurements nonetheless leave competing explanations unresolved.
References
Section titled “References”- H. Akaike, “A New Look at the Statistical Model Identification”, IEEE Transactions on Automatic Control 19, 716–723 (1974).
- R. D. dos Reis et al., “On the Search for the Chiral Anomaly in Weyl Semimetals: The Negative Longitudinal Magnetoresistance”, New Journal of Physics 18, 085006 (2016).
- M. Z. Hasan and C. L. Kane, “Colloquium: Topological Insulators”, Reviews of Modern Physics 82, 3045–3067 (2010).
- Joint Committee for Guides in Metrology, Evaluation of Measurement Data: Guide to the Expression of Uncertainty in Measurement, JCGM 100:2008.
- S. Kirkpatrick, “Percolation and Conduction”, Reviews of Modern Physics 45, 574–588 (1973).
- H. Pan and S. Das Sarma, “Physical Mechanisms for Zero-Bias Conductance Peaks in Majorana Nanowires”, Physical Review Research 2, 013377 (2020).
- C. J. Powell and A. Jablonski, “Progress in Quantitative Surface Analysis by X-ray Photoelectron Spectroscopy: Current Status and Perspectives”, Journal of Electron Spectroscopy and Related Phenomena 178–179, 331–346 (2010).
- E. Prada et al., “From Andreev to Majorana Bound States in Hybrid Superconductor–Semiconductor Nanowires”, Nature Reviews Physics 2, 575–594 (2020).