

Transport Measurements
An electrical transport measurement drives charge through a material and records terminal voltages or currents as functions of temperature, magnetic field, angle, frequency, gate voltage, pressure, and excitation amplitude. Its most immediate observable is a terminal response, not a scattering time, carrier density, mobility, gap, or phase. Those material inferences require a geometry model, a transport regime, a calibrated protocol, and checks that the sample remained in linear response and near the intended thermodynamic state.
For current sent into terminal and removed from terminal , define . If the voltage leads read , the measured transfer resistance is
where denotes the complete protocol: wiring, temperature, magnetic field, field history, excitation frequency, current amplitude, delay, filtering, and averaging. Writing the terminal indices prevents a common category error: two contact configurations on the same sample need not measure the same resistance.
Required background. How Quantum Matter Is Measured supplies calibration, resolution and forward-model checks. Conventions for Quantum Matter fixes charge, current and response-tensor signs. Transport Coefficients Preview supplies the constitutive relations and limiting procedures needed to distinguish a terminal resistance from an intrinsic material coefficient.
Electrical transport as a measurement problem
Section titled “Electrical transport as a measurement problem”Begin by identifying which contacts carry current and which sense voltage. Then establish whether a local resistivity is appropriate. Drude Theory and Boltzmann Transport describe diffusive carrier motion; Kubo Formula derives linear response. In a coherent mesoscopic conductor, Conductance Quantization instead relates terminal currents to transmissions. The same measured ratio can have a different interpretation in these regimes.
Specify the electrical measurement
Section titled “Specify the electrical measurement”A reproducible transport dataset should identify at least:
- sample: composition, dimensions, thickness convention, crystal axes, contact layout, substrate, gate stack, and thermal cycle;
- source: current- or voltage-bias mode, waveform, amplitude, frequency, compliance, source impedance, and reversal sequence;
- detector: voltage or current range, input impedance, bandwidth, filtering, phase convention, and calibration;
- environment: sample temperature, thermometer location, magnetic-field vector, pressure, illumination, and sweep history;
- reduction: offset subtraction, symmetrization, geometry conversion, tensor inversion, interpolation, and rejected points;
- uncertainty: repeatability, drift, calibration, geometry, alignment, temperature, field, and model dependence.
These conditions determine whether two measurements can be compared. For example, changing a lock-in frequency can change capacitive loading even when the plotted temperature and magnetic field are identical.
Four-Terminal Geometry
Section titled “Four-Terminal Geometry”Two terminals mix several voltage drops
Section titled “Two terminals mix several voltage drops”In a two-terminal measurement, the same pair of wires carries the source current and senses the voltage. In a simple lumped model,
where is the intended sample contribution, denotes contact or spreading resistance, denotes lead resistance, and collects thermoelectric and instrumental offsets. Two-terminal resistance is often the correct device observable, but it is generally not a bulk resistivity.
Separate current and voltage leads
Section titled “Separate current and voltage leads”In a four-terminal measurement, one pair of contacts sources and another pair senses . A voltmeter with input impedance draws only a small sense current. Voltage-lead and voltage-contact drops are therefore small when the sense circuit is sufficiently weakly loaded. More generally, replace the sample and its sense leads by their Thevenin equivalent: an open-circuit voltage and output impedance . The meter reads
The condition is , including the sample and lead contributions. A large nominal dc input resistance is insufficient if cable capacitance makes the input impedance small at the measurement frequency.
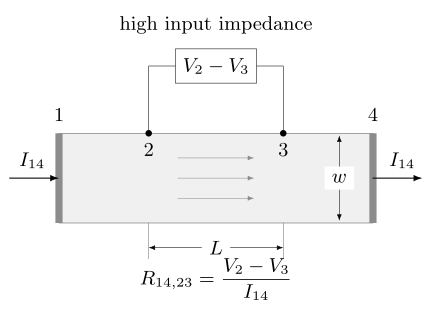
In an ideal homogeneous bar, current enters terminal 1 and leaves terminal 4; a high-impedance meter reads between the small sense contacts. The voltage spacing is and the width is . For uniform current density and negligible transverse response, , where is the conducting thickness. The drawing does not imply that real contacts are noninvasive.
Four-terminal sensing does not guarantee a noninvasive measurement. Current contacts can still:
- inject through a barrier or a nonlinear interface;
- create current crowding near a narrow contact;
- heat the electron system or the lattice;
- short part of a thin flake or edge channel;
- dope, strain, chemically modify, or electrostatically screen the sample;
- force current through an inhomogeneous percolation path.
Voltage contacts can also perturb a mesoscopic conductor even when their dc input current is small. In a coherent device, a voltage probe is a boundary condition and reservoir, not merely an ideal observer. The Landauer–Büttiker framework treats this reservoir effect explicitly (Büttiker, 1986).
Longitudinal Resistance
Section titled “Longitudinal Resistance”Resistance is configuration dependent
Section titled “Resistance is configuration dependent”“Longitudinal” means that the voltage separation is intended to follow the mean current direction. The adjective does not prove that the measured voltage contains only a longitudinal electric field. Misaligned contacts, anisotropy, inhomogeneous current flow, and transverse response can all contribute.
For a nonlinear current–voltage curve, distinguish the chord and differential resistances:
They agree only in a linear regime after offsets have been handled. A lock-in amplifier approaches the differential response as the ac excitation amplitude tends to zero. At finite amplitude it measures a Fourier component over the driven current range; exercise 5 quantifies the difference.
Field parity is a diagnostic, not a universal correction
Section titled “Field parity is a diagnostic, not a universal correction”In a nonmagnetic sample in a reversible state, an intended longitudinal channel is commonly even in magnetic field, whereas an ordinary Hall admixture is odd. One therefore forms
This decomposition is algebraically exact, but naming the pieces “longitudinal” and “Hall” adds physical assumptions. It can fail when magnetization, domains, metastability, or the sample temperature differ between the two field points.
A useful linear-response check is Onsager–Casimir reciprocity (Onsager, 1931; Casimir, 1945). With all time-reversal-odd internal variables represented collectively by ,
Testing reciprocal lead configurations can reveal wiring errors, drift, nonlinearity, or a state that was not reversed. Reciprocity is not a license to average genuinely hysteretic branches into one curve.
From Resistance to Conductivity
Section titled “From Resistance to Conductivity”Uniform rectangular bar
Section titled “Uniform rectangular bar”If current density is uniform along a homogeneous bar of width , thickness , and voltage-probe separation , then
only when the scalar approximation is valid. The measured has units of ohms; the three-dimensional resistivity has units of .
This conversion assumes that:
- the current contacts establish nearly uniform flow before the voltage region;
- and describe the electrically active cross section;
- voltage contacts are small compared with ;
- the material is homogeneous over the sampled region;
- nonlocal and ballistic effects are negligible;
- off-diagonal tensor components do not alter the conversion.
Violation of these assumptions calls for a Laplace-equation, finite-element, conformal-mapping, or multi-terminal model rather than a more precise measurement of the same geometric dimensions.
Thin films and sheet resistance
Section titled “Thin films and sheet resistance”For a uniform film,
is called sheet resistance and is reported in ohms, often annotated as to remind the reader that a square has . “Ohms per square” is not a new SI dimension. When conduction occupies several parallel layers or a thickness-dependent surface region, converting to a bulk using the physical thickness can be misleading.
van der Pauw extraction
Section titled “van der Pauw extraction”At zero magnetic field with no internal time-reversal-breaking state, consider a homogeneous, isotropic, simply connected sheet of uniform thickness with four small boundary contacts labeled 1, 2, 3, 4 in cyclic order. Take the positive transfer resistances and , averaged over equivalent reversed and reciprocal configurations. They determine through
When , this reduces to
The NIST measurement procedure describes the reversed and reciprocal configurations in detail. The stated formula does not apply unchanged to large interior contacts, holes, thickness gradients, anisotropy, or inhomogeneity. Reversal and reciprocal configurations provide valuable internal checks before the nonlinear equation is solved. Anisotropic rectangular samples may instead require a Montgomery analysis or a numerical current-flow model with the crystal axes and contact geometry stated explicitly.
Conductivity is a tensor inverse
Section titled “Conductivity is a tensor inverse”In a magnetic field or anisotropic crystal,
Tensor inversion is not elementwise inversion. For an in-plane isotropic system with antisymmetric transverse response,
Replacing by is justified only when or when symmetry removes the transverse component. Sign conventions for and must be declared rather than inferred from a plot.
Excitation and Readout
Section titled “Excitation and Readout”Current reversal
Section titled “Current reversal”At fixed environment, expand the measured voltage around zero current:
The current-odd and current-even combinations are
A static thermoelectric offset enters , so estimates at sufficiently small . Current reversal does not remove odd nonlinearities such as , nor does it guarantee that the sample returns to the same temperature or state between polarities. Measuring several amplitudes is more informative than trusting one reversed pair.
Useful sequence checks include or interleaved positive and negative currents. Zero-current readings track drift, while randomized or symmetric ordering reduces bias from a monotonic temperature drift. Waiting times must exceed the relevant electrical and thermal settling times.
AC and lock-in measurements
Section titled “AC and lock-in measurements”With a sinusoidal current , phase-sensitive detection extracts the voltage component at the reference frequency. Define the complex transfer impedance
Its in-phase part approaches the dc transfer resistance only when the sample, wiring, filters, preamplifier, and lock-in are all in a quasistatic regime. Stray capacitance, inductive pickup, dielectric loss, and phase errors can produce a quadrature signal or frequency dependence unrelated to intrinsic material dynamics.
Lock-in detection narrows the effective noise bandwidth, but it does not know which signal at the reference frequency came from the sample. Capacitive pickup from the source line, ground loops, vibration in a field gradient, and temperature modulation can all be phase coherent. Tests at several frequencies, cable configurations, and time constants are therefore part of the measurement rather than optional instrumentation details.
Higher harmonics are diagnostics. A voltage at can arise from cubic electrical response or from Joule heating combined with ; a response at can reveal an even-in-current process, asymmetric contacts, or thermoelectric conversion. The harmonic label alone does not identify a mechanism.
Noise, bandwidth, and loading
Section titled “Noise, bandwidth, and loading”For a resistor in equilibrium, the classical open-circuit Johnson–Nyquist voltage noise over a one-sided equivalent noise bandwidth is
This estimate requires throughout the relevant band, an approximately real frequency-independent impedance, and a meter that does not appreciably load the resistor. The equivalent noise bandwidth includes the filters; it is not generally their stated bandwidth. Real measurements also contain amplifier voltage and current noise, source noise, contact fluctuations, pickup, digitization and low-frequency drift. Increasing current raises the signal linearly but the Joule power quadratically:
The useful excitation lies between a noise floor and a perturbation ceiling. Demonstrating an amplitude-independent resistance over a stated range is stronger evidence for linear response than quoting the smallest available current.
Finite voltmeter input impedance causes loading, especially for highly resistive samples. Leakage through cables, filters, substrates, cryostat wiring, or gate dielectrics can then compete with the sample current. Guarding and insulation help, but an open-circuit and dummy-load test are needed to quantify the background path.
Temperature Sweeps
Section titled “Temperature Sweeps”The thermometer reports its own temperature. The sample temperature agrees only after thermal gradients and time constants are controlled. A trustworthy temperature sweep records:
- thermometer identity, calibration, mounting, and distance from the sample;
- heating or cooling direction and sweep rate;
- stabilization criterion or dwell time;
- excitation amplitude and dissipated power;
- vacuum, exchange gas, or thermal-link conditions;
- repeated cycles and any irreversible sample change.
Near a sharp transition, a continuous sweep can turn thermal lag into an apparent hysteresis or shift. Compare warming and cooling at several rates, then repeat selected points after full stabilization. A current-dependence check separates an intrinsic transition width from self-heating or depinning.
Common summaries require care:
- Residual-resistivity ratio: a ratio such as can compare samples when the same geometry remains valid, but it does not uniquely measure one defect density or scattering mechanism.
- Activated behavior: a straight segment of versus is evidence for an effective scale over that interval, not proof of a unique band gap. Contact freeze-out, parallel conduction, variable-range hopping, and temperature-dependent geometry are alternatives.
- Zero resistance: a value below the instrumental resolution supports a percolating low-resistance path. Bulk superconductivity requires complementary magnetic or thermodynamic evidence.
- Linear-in-temperature resistance: the fitted interval, intercept, current dependence, geometry, and competing power laws must be reported before attaching a microscopic “strange-metal” mechanism.
Magnetic-Field and Angle Sweeps
Section titled “Magnetic-Field and Angle Sweeps”A field sweep changes more than the Hamiltonian. Moving flux induces voltage,
while eddy currents heat metallic structures and magnetocaloric effects can shift the sample temperature. Magnetic domains, vortices, and first-order transitions can retain field history. A complete protocol therefore records sweep direction, rate, maximum excursion, zero-field preparation, magnet polarity, persistent-switch state, and sample temperature during the sweep.
For longitudinal magnetotransport:
- measure both field polarities with the same wiring;
- repeat with current reversal or low-frequency phase-sensitive detection;
- inspect even and odd field components without automatically discarding either;
- exchange current and voltage terminals to test reciprocity where applicable;
- vary sweep rate and excitation to test heating and dynamics;
- repeat representative points after stabilized field steps.
An angle sweep needs a coordinate convention and a misalignment estimate. A small perpendicular component can dominate a nominally in-plane measurement in a high-mobility two-dimensional system. Mechanical backlash and sample rotation relative to thermometry or wiring can add apparent angular structure.
Compare the measured response with a physical model
Section titled “Compare the measured response with a physical model”Use the amplitude, frequency, reversal and settling checks above before assigning a material coefficient. Preserve the raw voltages alongside the geometry-normalized result so that offsets, sign choices and the assumed conducting thickness can be examined.
A local diffusive model, a hopping network, a ballistic channel and a superconducting path predict different relations between terminal current and voltage. Choose a model that explains the control-parameter dependence and remains valid over the fitted range. Data Interpretation and Pitfalls develops tests for current jetting, parallel channels and heating. Spectroscopy, microscopy or thermodynamics can distinguish alternatives that transport alone leaves unresolved.
Uncertainty Budget
Section titled “Uncertainty Budget”For a uniform bar with , an independent-input approximation gives
Correlated dimensions require covariance terms. More importantly, this expression covers parameter uncertainty within the bar model; it does not quantify bias from current crowding, parallel channels, cracks, an electrically inactive thickness, or a wrong constitutive regime.
Separate the main sources of uncertainty:
- repeatability: short-term scatter under an unchanged protocol;
- drift: changes with time, temperature, contact aging, or thermal cycling;
- instrument calibration: source current, voltage gain, phase, field, and thermometer;
- geometry: contact separation, width, thickness, edge roughness, and active cross section;
- state preparation: field history, sweep direction, dwell time, illumination, and gate history;
- model discrepancy: current distribution, tensor structure, parallel channels, and nonlocality.
Report enough significant figures to reflect this budget. A nanovoltmeter can resolve many digits while the sample thickness remains uncertain by ten percent.
Exercises
Section titled “Exercises”1. Two-terminal and four-terminal resistance
Section titled “1. Two-terminal and four-terminal resistance”A sample has . Each current contact contributes , and each current lead contributes . Ignore voltage offsets. What does the two-terminal measurement read? What ideal four-terminal value is obtained when the sense current is negligible?
Solution
The two-terminal path contains the sample, two contacts, and two leads:
The ideal four-terminal voltage probes sample only the potential difference across the intended sample region, so
This answer assumes the current contacts do not alter the current distribution or heat the sample. Four terminals reject their series voltage drops; they do not prove that the contacts are physically noninvasive.
2. Current reversal
Section titled “2. Current reversal”At , a voltmeter reads and . Find the current-odd voltage, the current-even voltage, and the linear-resistance estimate.
Solution
The odd and even combinations are
Therefore
The even component is consistent with a static offset or an even-in-current effect. A second current amplitude is needed to test whether the odd response is truly linear.
3. Geometry and uncertainty
Section titled “3. Geometry and uncertainty”A bar gives with , , and . Find . If the independent relative standard uncertainties in are , estimate the relative uncertainty in .
Solution
The bar conversion gives
Equivalently, . The independent-input estimate is
Thus at one standard uncertainty within the uniform-bar model. Thickness dominates the stated budget.
4. Symmetric van der Pauw sample
Section titled “4. Symmetric van der Pauw sample”A van der Pauw measurement gives equal reversed and averaged transfer resistances . Find the sheet resistance. If the conducting thickness is , what bulk resistivity follows under the uniform-film assumption?
Solution
For equal transfer resistances,
The corresponding uniform-film resistivity is
The numerical conversion is invalid if only a surface layer, edge network, or unknown fraction of the nominal thickness conducts.
5. A finite-amplitude lock-in response
Section titled “5. A finite-amplitude lock-in response”Suppose , with and . Drive with peak amplitude . Find the resistance inferred from the fundamental voltage amplitude divided by , the third-harmonic voltage amplitude, and the resistance inferred by dc reversal at .
Solution
Since ,
The differential resistance at zero current is . Both inferred values approach it as , but neither equals it at this finite amplitude. For the fundamental ratio, converting both voltage and current consistently to rms leaves the ratio unchanged; do not substitute an rms amplitude into the peak-amplitude nonlinear formula. A third harmonic in a real sample can also come from heating, so observing it does not determine as an intrinsic electronic coefficient.
6. Self-heating scale
Section titled “6. Self-heating scale”A device has and thermal conductance to its bath. Estimate the steady temperature rise in the simple model for currents of and .
Solution
At ,
so . Increasing current by ten multiplies power by one hundred:
The simple thermal-conductance model may itself be temperature dependent, but the calculation shows why “only ten times more current” can destroy a low-temperature transport measurement.
Continue with transverse signals and contact effects
Section titled “Continue with transverse signals and contact effects”Hall Measurements develops transverse-voltage polarity, tensor fitting and multichannel limits. Quantum Oscillations explains inverse-field spectra and damping fits. For sample preparation and contact effects, use Device Fabrication Concepts; for coherent transport, continue to Conductance Quantization.
References
Section titled “References”- M. Büttiker, “Four-Terminal Phase-Coherent Conductance”, Physical Review Letters 57, 1761–1764 (1986).
- H. B. G. Casimir, “On Onsager’s Principle of Microscopic Reversibility”, Reviews of Modern Physics 17, 343–350 (1945).
- Joint Committee for Guides in Metrology, Evaluation of Measurement Data—Guide to the Expression of Uncertainty in Measurement, JCGM 100:2008.
- H. C. Montgomery, “Method for Measuring Electrical Resistivity of Anisotropic Materials”, Journal of Applied Physics 42, 2971–2975 (1971).
- National Institute of Standards and Technology, “Resistivity and Hall Measurements”, measurement procedure and consistency checks.
- L. Onsager, “Reciprocal Relations in Irreversible Processes. II”, Physical Review 38, 2265–2279 (1931).
- D. K. Schroder, Semiconductor Material and Device Characterization, 3rd ed., Wiley (2006).
- J. H. Scofield, “Frequency-Domain Description of a Lock-in Amplifier”, American Journal of Physics 62, 129–133 (1994).
- Tektronix and Keithley Instruments, Low Level Measurements Handbook: Precision DC Current, Voltage, and Resistance Measurements, 7th ed.
- L. J. van der Pauw, “A Method of Measuring Specific Resistivity and Hall Effect of Discs of Arbitrary Shape,” Philips Research Reports 13, 1–9 (1958).