

How Quantum Matter Is Measured
Quantum matter is measured by preparing a sample in a documented environment, coupling a calibrated probe to selected degrees of freedom, recording detector outputs, and comparing those records with a forward model. The detector does not directly announce “a Fermi surface,” “a spin liquid,” or “a topological phase.” It records voltages, currents, counts, arrival times, photon fields, forces, temperatures, or pixels. Physical interpretation begins only after calibration, normalization, background treatment, resolution modeling, and tests against competing explanations.
It helps to distinguish five stages of the reasoning:
- Raw record: digitizer values, detector counts, images, or time traces.
- Calibrated measurand: voltage, intensity, momentum transfer, energy loss, magnetization, heat capacity, or another quantity with units and uncertainty.
- Probe-level observable: conductivity, spectral intensity, structure factor, local tunneling conductance, susceptibility, or a related response.
- Material inference: gap, carrier density, correlation length, excitation dispersion, order parameter, or quasiparticle scale.
- Mechanism or phase claim: a model and alternatives are confronted with several independent observables.
Every step adds assumptions. Reprocessing the same record through several plotting conventions does not create several independent measurements.
Required background. From Models to Measured Observables supplies the system, state, observable and resolution choices needed to pose a measurement problem. Correlation Functions Overview supplies operator channels, ordering and connected correlations, while What Is a Scattering Experiment? supplies the conversion from detector counts to normalized cross sections.
From measured signals to quantum-material observables
Section titled “From measured signals to quantum-material observables”The central question is: what did the apparatus record, which physical quantity does the probe couple to, and what assumptions connect the two? A resistance trace, for example, becomes a resistivity only after a model for contacts, dimensions and current flow has been justified.
The quantum measurement formalism explains outcome probabilities and conditional state updates. Here we focus on the laboratory conversion from signals to material properties. Kubo Formula, Spectral Functions, and Structure Factors derive the theoretical objects used below. The chapter guide helps choose an individual probe.
Predicting what the detector records
Section titled “Predicting what the detector records”A forward model comes before an inversion
Section titled “A forward model comes before an inversion”Let denote the true kinematic variables, spatial coordinates, or frequencies relevant to a signal , where contains material parameters. A detector bin can often be modeled schematically as
is the instrument response, including acceptance, efficiency, resolution, and matrix elements; denotes calibrated or fitted instrument parameters. is a background model with nuisance parameters , and represents counting or readout fluctuations.
The response kernel explains why the detector generally does not reproduce the intrinsic signal :
- finite resolution convolves nearby features;
- matrix elements can suppress allowed excitations;
- detector acceptance omits parts of phase space;
- background subtraction can change weak signals;
- several intrinsic spectra may fit the same finite data;
- calibration uncertainty propagates into material parameters.
The forward problem predicts records from a sample and apparatus model. The inverse problem infers sample properties from records. Inverse problems may be ill conditioned or non-identifiable: small changes in data can produce large changes in inferred parameters, or distinct parameter sets can produce practically indistinguishable records.
Specify the sample and the measurement
Section titled “Specify the sample and the measurement”To reproduce or interpret a result, identify:
- Sample: composition, structure, dimensions, orientation, contacts, history, domain state, and batch identity.
- Preparation: temperature, pressure, field, gate bias, illumination, wait time, and sweep history.
- Coupling: which field or projectile couples to which charge, current, spin, orbital, lattice, or pair operator.
- Detector: recorded quantity, gain, efficiency, acceptance, resolution, dead time, and saturation.
- Data reduction: calibration, normalization, masking, symmetrization, filtering, background, and uncertainty propagation.
- Physical model: forward model, parameter priors or constraints, fit diagnostics, alternative models, and held-out tests.
A result can be reproducible at one layer and fragile at another. The electronics may reproduce the same voltage while contact geometry changes its relation to bulk resistivity. A diffraction peak may reproduce while its assignment to one structural domain remains ambiguous.
Response, Spectroscopy, Imaging, and Thermodynamics
Section titled “Response, Spectroscopy, Imaging, and Thermodynamics”These categories overlap, but they ask different questions.
Response measurements
Section titled “Response measurements”A response experiment applies a controlled source coupled to an operator through and records the change of an observable . Linear response gives
Transport, magnetic susceptibility, dielectric response, and many optical measurements fit this pattern. The object inferred is a protocol-dependent response coefficient. The source amplitude must be small enough for linearity, the relevant order of limits must be stated, and heating or hysteresis must be checked.
A dc resistance is not a Hamiltonian eigenvalue. It depends on geometry, contacts, dissipation, current paths, and the limit . A static susceptibility likewise depends on whether the field is applied before or after the thermodynamic limit and on demagnetization fields in a finite sample.
Spectroscopy
Section titled “Spectroscopy”Spectroscopy resolves energy transferred to or from a material. In a weak-probe description, a transition rate contains an operator matrix element and an energy-conservation kernel:
After summing over occupied initial states and accepted final states, one obtains a spectral function, structure factor, susceptibility, or a more complicated cross section. Spectral peak positions can reveal energy differences only when matrix elements give them weight; overlapping lines and backgrounds can also shift the maximum of a measured feature. Damascelli, Hussain and Shen (2003) illustrate these distinctions for photoemission, while Van Hove (1954) relates scattering to dynamical correlations. Peak widths can combine intrinsic lifetime, inhomogeneity, finite observation time, and instrument resolution.
Angle-resolved photoemission, tunneling spectroscopy, neutron and x-ray energy-loss measurements, Raman scattering, and infrared absorption are spectroscopies, but they do not measure one universal “density of states.” Their coupling operators and final states differ.
Imaging and mapping
Section titled “Imaging and mapping”An image assigns a measured signal to positions, pixels, scan coordinates, or reconstructed real-space voxels. The displayed contrast need not be a literal map of atomic height or charge density. For example:
- constant-current STM topography mixes geometric height with an energy-integrated tunneling signal;
- magnetic-force and scanning-SQUID images are convolutions with a tip or pickup-loop response;
- coherent diffraction images require phase retrieval;
- spectroscopic maps inherit both spatial and energy resolution;
- domain contrast can depend on polarization, scan direction, and surface termination.
An image should therefore be accompanied by a point-spread function, pixel size, field of view, drift treatment, color scale, and the forward model that assigns contrast to a material quantity.
Thermodynamic and integrated measurements
Section titled “Thermodynamic and integrated measurements”Heat capacity, magnetization, thermal expansion, and bulk susceptibility usually integrate over momentum and often over many excitation channels. They can test bulk phase transitions and entropy changes without selecting a particular surface termination or momentum. A thermodynamic singularity belongs to an equilibrium large-system limit; a finite sample can instead show a rounded anomaly or a smooth crossover.
Integration is both a strength and a limitation. A reproducible heat-capacity anomaly constrains bulk energetics but does not alone identify a phase transition or its microscopic order; smooth Schottky anomalies are a familiar counterexample. Conversely, a sharp spectroscopic mode can identify an excitation without proving that the entire sample enters a thermodynamic phase. The two kinds of evidence are complementary.
Resolution in Four Coordinates
Section titled “Resolution in Four Coordinates”Resolution describes how sharply the apparatus distinguishes nearby values. It must be quoted together with its definition: standard deviation, full width at half maximum, bin width, Rayleigh criterion, or another convention.
Energy resolution
Section titled “Energy resolution”If an intrinsic line is measured with a normalized energy-resolution kernel , then
For Gaussian intrinsic and instrumental profiles with standard deviations and ,
This quadrature rule is not valid for arbitrary line shapes. Lorentzian widths add linearly under convolution, and mixed Gaussian–Lorentzian profiles require a Voigt or more physical model. Blind numerical deconvolution can amplify noise and create artificial substructure.
For a concrete example, let an intrinsic spectrum contain two equal-area Gaussian lines centered at , each with . A Gaussian instrument with broadens each line to and leaves two maxima. With , each becomes wide and their sum has only one maximum. The excitation energies have not changed.
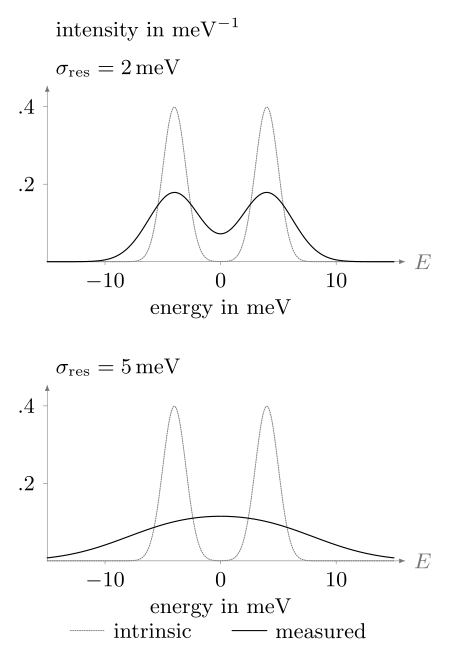
A normalized Gaussian instrument response broadens a fixed doublet. Dotted curves show the intrinsic spectrum; solid curves show its convolution with the stated resolution. The vertical scale is shared and the total area is preserved. Here widths are standard deviations, not FWHM. A single measured maximum therefore need not represent a single excitation.
Convolution does not make every sub-resolution parameter impossible to estimate. With a well-tested line model, sufficiently low noise and accurate calibration, a fit can distinguish splittings smaller than a visual peak width. That conclusion is conditional on the model; resolving two visible maxima and identifying two underlying excitations are different questions.
Momentum resolution
Section titled “Momentum resolution”Diffraction and inelastic scattering infer momentum transfer from beam energy and angles. ARPES infers crystal momentum components from photoelectron energy and direction, with a model-dependent treatment of the surface-normal component. Momentum resolution receives contributions from angular divergence, beam bandwidth, sample mosaic, finite illuminated area, and detector pixels.
A finite real-space correlation length broadens a reciprocal-space peak on a scale of order
but the numerical coefficient depends on dimensionality, correlation function, scan direction, and width convention. Instrumental broadening must be separated before assigning .
Spatial resolution
Section titled “Spatial resolution”Spatial resolution is set by more than pixel spacing. It includes the probe spot, tip shape, interaction volume, diffusion during acquisition, drift, vibration, and reconstruction algorithm. Sampling a field on a grid does not imply physical resolution if the point-spread function is wide.
Local probes trade field of view, acquisition time, perturbation strength, and signal-to-noise against resolution. Atomic contrast on one surface does not by itself establish bulk uniformity.
Time resolution
Section titled “Time resolution”In pump–probe measurements, the effective time resolution is often the cross-correlation of pump and probe envelopes plus timing jitter and detector response. A short pulse has a broad Fourier bandwidth. For a transform-limited Gaussian pulse, temporal and spectral widths obey a pulse-shape-specific time–bandwidth product; this is not a universal claim that every energy measurement disturbs a sample for .
The relevant question is whether the apparatus can separate the material timescales of interest: electronic redistribution, dephasing, phonon motion, thermalization, domain evolution, and heat diffusion.
Resolution, range, and sensitivity are different
Section titled “Resolution, range, and sensitivity are different”An instrument can have fine resolution but poor sensitivity, a narrow dynamic range, or incomplete phase-space coverage. Reports should distinguish:
- resolution: separation of nearby features;
- accuracy: closeness to the true value, assessed in practice using suitable reference measurements;
- precision: repeatability of the record;
- sensitivity: change in record per change in measurand;
- detection limit: smallest signal distinguishable under a decision rule;
- range and acceptance: values and channels the apparatus can record.
High precision cannot correct an inaccurate calibration, and high energy resolution does not recover excitations forbidden by the probe matrix element.
Bulk and Surface Probes
Section titled “Bulk and Surface Probes”Every probe has a depth-weighting kernel
Section titled “Every probe has a depth-weighting kernel”A measured signal from depth-dependent material response can be written
For a simple attenuation model,
where is an effective attenuation length and the kernel is normalized. For a depth-independent response, the first contributes of the signal, while about is needed for . A quoted information depth must specify the chosen fraction. If varies, fractions of the kernel and fractions of the measured signal are different. Real kernels also depend on incidence and exit angles, energy, elastic scattering and geometry.
Photoemission and STM are strongly surface sensitive. Soft and hard x rays, electrons, ions, neutrons, optical fields, and magnetic probes sample different depths and volumes. “Bulk sensitive” never means uniform sensitivity to an infinite depth; it means that the weighting reaches sufficiently far into the sample for the stated inference.
The surface is a different physical system
Section titled “The surface is a different physical system”A cleaved or grown surface can reconstruct, change stoichiometry, bend bands, accumulate charge, adsorb contaminants, host different domains, or break a protecting symmetry. These changes can be scientifically central rather than mere imperfections.
To compare surface and bulk probes:
- document surface preparation and elapsed time;
- vary photon energy, incidence angle, tip condition, or another depth-sensitive control;
- compare several cleaves, positions, and batches;
- use bulk-sensitive diffraction, thermodynamics, or transport where appropriate;
- model how a surface state, accumulation layer, or reconstruction contributes to each signal.
Agreement across depth sensitivities is powerful. Disagreement is diagnostic and should not be averaged away.
Equilibrium and Nonequilibrium Probes
Section titled “Equilibrium and Nonequilibrium Probes”Equilibrium is a preparation statement
Section titled “Equilibrium is a preparation statement”Thermal equilibrium requires a state consistent with the specified temperature and other conserved quantities, with no sustained driving or net thermodynamic currents. Stationarity on the acquisition timescale is necessary but not sufficient: a driven steady state can have time-independent averages. The probe may cause transitions, but its backaction must be weak enough that the equilibrium state remains a valid reference for the analysis.
In thermal equilibrium, correlation and response functions are linked by fluctuation–dissipation relations. For a Hermitian observable , a source , and the forward transform , define
For the finite-frequency inelastic part,
The absorptive part is nonnegative at positive frequency in this equilibrium convention. Any elastic zero-frequency contribution must be handled separately. Cross-channel correlations require the corresponding dissipative response matrix, rather than an arbitrary elementwise imaginary part. Fluctuation–Dissipation Theorem derives those forms and their convention translations, following the connection developed by Callen and Welton (1951) and Kubo (1957). Detailed balance tests equilibrium in the channels and frequencies measured; agreement in one channel alone does not establish a thermal state for the whole sample.
Sweeps can leave equilibrium
Section titled “Sweeps can leave equilibrium”Field, temperature, gate, pressure, or current sweeps may encounter slow relaxation, metastability, domain pinning, eddy-current heating, thermal lag, or first-order hysteresis. A trace acquired at a nominal control value can retain memory of the path used to reach it.
Useful checks include:
- reverse the sweep direction;
- vary the sweep rate and dwell time;
- compare field-cooled and zero-field-cooled protocols;
- monitor thermometer and sample-stage lag;
- reduce probe current or intensity;
- repeat after thermal or magnetic reset.
Hysteresis demonstrates history dependence. By itself it does not identify ferromagnetism, a first-order phase transition, or any particular microscopic mechanism.
Pump–probe measurements are two-time experiments
Section titled “Pump–probe measurements are two-time experiments”A pump prepares a nonequilibrium state; a delayed probe samples its evolution. The signal is generally a functional of both times,
or of average time and relative time. Time-translation invariance is lost, so an equilibrium spectrum depending only on one frequency need not exist.
Interpreting a transient signal through an effective temperature or instantaneous band structure requires a timescale argument. Electrons, phonons, spins, and domains can have different distributions and relaxation rates. A pump-induced reduction in an order-sensitive signal may arise from heating, screening, matrix-element changes, dephasing, or a true change of order. Fluence dependence, depth matching, polarization controls, absorbed-energy estimates, and recovery dynamics are therefore part of the claim.
What Common Probes Actually Measure
Section titled “What Common Probes Actually Measure”The following are leading correspondences, not exact identities. Every entry is modified by matrix elements, geometry, acceptance, and resolution.
- dc transport. The primary records are voltages and currents. Geometry and a low-frequency device model convert them into resistance or conductivity tensors. Contacts, inhomogeneous current paths, heating, and current jetting are central cautions.
- Hall measurement. The record is a transverse voltage under field or magnetization reversal. Antisymmetrization and geometry lead to Hall resistivity or conductivity. Longitudinal pickup, multiband transport, anomalous Hall terms, and hysteresis can complicate carrier-density inference.
- Quantum oscillations. Oscillatory resistance, torque, or magnetization versus constrains extremal orbit areas and damping factors of mobile carriers. Finite field windows, harmonics, Zeeman splitting, magnetic breakdown, and background subtraction affect the result.
- ARPES. Photoelectron counts versus energy and angle give a matrix-element- and occupation-weighted removal spectrum with surface weighting and momentum resolution. Final states, assignment, charging, surface aging, and matrix-element zeros matter.
- STM and STS. Current and differential conductance versus position and bias approximate a tunneling-weighted local spectral density at the topmost surface. Tip states, setpoint, barrier shape, drift, and surface reconstruction enter the forward model.
- Neutron scattering. Counts versus momentum and energy transfer probe nuclear and magnetic structure factors in the bulk. Form factors, polarization, multiple scattering, sample volume, resolution, and background must be included.
- X-ray scattering. Photon counts versus momentum, energy, and polarization encode charge, lattice, orbital, or resonant cross sections with energy- and geometry-dependent depth sensitivity. Absorption, fluorescence, self-absorption, domains, and the resonance model are common complications.
- Raman, infrared, and THz methods. Intensity or electric-field amplitude and phase versus frequency constrain Raman susceptibilities, dielectric functions, or optical conductivities near zero photon momentum and over a finite penetration depth. Selection rules, extrapolation, substrates, phonons, and heating matter.
- Thermodynamics and magnetometry. Heat flow, temperature, force, torque, or magnetic moment lead to heat capacity, entropy changes, magnetization, or susceptibility integrated over sample volume. Addenda, demagnetization, impurity tails, subtraction, and equilibration set important systematics.
- Pump–probe methods. Delay-dependent optical, photoemission, or diffraction changes sample a nonequilibrium response or correlation snapshot with finite time and depth weighting. Coherent artifacts, fluence, depth mismatch, heating, and nonthermal distributions constrain interpretation.
Transport is weighted toward long-lived mobile channels
Section titled “Transport is weighted toward long-lived mobile channels”Conductivity emphasizes states and scattering processes that carry current. A small, high-mobility band can dominate transport while containing a minority of carriers. Contact resistance can dominate a two-terminal device, and anisotropic samples can distort current paths. Transport is therefore not a direct density-of-states measurement.
Spectroscopy is operator selective
Section titled “Spectroscopy is operator selective”ARPES inserts an electron-removal operator and observes an outgoing electron after photoexcitation. Neutron spin scattering couples to magnetization components transverse to momentum transfer, weighted by magnetic form factors and polarization geometry. Raman scattering selects symmetry channels through photon polarizations. A missing peak may mean absence, weak matrix element, wrong polarization, inaccessible momentum, or insufficient sensitivity.
Thermodynamics counts states without locating them
Section titled “Thermodynamics counts states without locating them”At low temperature, electronic heat capacity can constrain a density of low-energy states, while entropy integration tests how much spectral weight participates in a transition. Magnetization and susceptibility constrain net moments and field response. These are bulk-integrated quantities: they can test whether a spectroscopic feature is representative, but they rarely reveal its full momentum structure.
From Several Probes to One Claim
Section titled “From Several Probes to One Claim”Compare probes with different limitations
Section titled “Compare probes with different limitations”Choose probes whose dominant limitations differ. For a proposed bulk gap:
- transport can show activated conduction but is vulnerable to parallel channels;
- optical spectroscopy can constrain absorption onset and residual conductivity;
- tunneling can map a local single-particle suppression but is surface sensitive;
- heat capacity can test for residual bulk low-energy states;
- diffraction can detect a structural transition that offers an alternative mechanism.
Five spectra taken with the same surface-sensitive matrix element are less independent than one surface spectrum, one bulk thermodynamic measurement, and one structural control.
A phase claim needs scale, symmetry, and reproducibility
Section titled “A phase claim needs scale, symmetry, and reproducibility”A defensible phase assignment normally combines:
- a stated symmetry or topological distinction;
- a bulk or finite-size criterion appropriate to that distinction;
- characteristic excitations or response;
- control-parameter evolution and limiting cases;
- exclusion of plausible structural, magnetic, contact, and heating artifacts;
- repeatability across positions and samples;
- consistency among probes with different couplings and depths.
The decisive tests depend on the proposed phase. A superconducting phase, a density wave, a topological band structure and a spin liquid differ in their defining properties. Use the From Models to Measured Observables to connect the measurements to the relevant physical criteria.
Reporting and Uncertainty
Section titled “Reporting and Uncertainty”Keep raw, corrected, and inferred quantities separate
Section titled “Keep raw, corrected, and inferred quantities separate”A figure should make clear whether it shows:
- unprocessed counts or digitizer output;
- calibrated but uncorrected data;
- background-subtracted or normalized data;
- deconvolved or symmetrized data;
- a fitted model component;
- an inferred physical parameter.
Preserve the transformation chain and code. A smooth published curve without the raw record can conceal dead pixels, masked regions, drift corrections, normalization choices, or unstable fits.
Uncertainty follows the measurement model
Section titled “Uncertainty follows the measurement model”If an inferred quantity depends on inputs with covariance matrix , first-order propagation around the estimated inputs gives (JCGM 100:2008)
This includes correlated calibration and nuisance inputs. Counting statistics alone are rarely the complete uncertainty. Model discrepancy, sample variation, background choice, and non-identifiability may require sensitivity intervals, alternative models, hierarchical analysis, or explicit qualitative limitations rather than one standard error.
State how an interval was obtained. A frequentist confidence procedure has a specified repeated-sampling coverage; a Bayesian credible interval has a posterior probability conditional on its likelihood and prior. Neither automatically includes an omitted calibration error or an inadequate physical model. A curve drawn without error bars is not exact data.
Exercises
Section titled “Exercises”1. Separate instrumental and intrinsic width
Section titled “1. Separate instrumental and intrinsic width”A Gaussian spectral peak has measured full width at half maximum . The independently calibrated Gaussian energy resolution is FWHM. Estimate the intrinsic FWHM.
Solution
For Gaussian profiles, variances add under convolution. Because FWHM is proportional to the standard deviation by the same factor for every Gaussian, the squared FWHM values also add:
This estimate is valid only if both line shapes are well described by Gaussians and the resolution calibration applies to the same settings. A Lorentzian intrinsic line convolved with a Gaussian instrument response requires a Voigt analysis.
2. Quantify surface weighting
Section titled “2. Quantify surface weighting”For and a uniform response , what fraction of the signal originates within the first of the surface? How does the answer change if ?
Solution
The fraction is
For a uniform response, about comes from this depth. If the response also decreases as , normalize the product instead:
The same instrument now collects of its signal from that layer. Depth fractions therefore require both a sensitivity kernel and a model for the sample.
3. Diagnose a missing spectroscopic peak
Section titled “3. Diagnose a missing spectroscopic peak”A calculated excitation at is absent from one polarization channel of a scattering experiment. Give four explanations that do not require the excitation itself to be absent, and propose a discriminating test.
Solution
Possible explanations include:
- a symmetry or polarization selection rule makes the matrix element vanish;
- lies outside the instrument acceptance or is misassigned;
- the mode is broader than the sensitivity permits because of intrinsic decay or inhomogeneity;
- background, absorption, or resolution obscures the feature.
Change polarization or sample orientation while keeping the target point accessible, map neighboring momenta, and measure a reference mode with known symmetry. A matrix-element zero should follow the predicted geometry. Continued non-detection constrains a mode only where the calibrated sensitivity would have detected its predicted intensity.
4. Identify a non-identifiable inversion
Section titled “4. Identify a non-identifiable inversion”A measured line is fitted equally well by two narrow intrinsic peaks convolved with the calibrated resolution and by one broader asymmetric intrinsic peak. What can be concluded, and what measurement would help?
Solution
The current data establish spectral weight over the observed energy interval but do not identify whether the intrinsic response has one component or two. Reporting the two-peak separation as a resolved splitting would exceed the information in the record.
Useful additions include a measurement with substantially narrower and independently calibrated resolution, a polarization or momentum setting that changes the two proposed components differently, or a second probe with different matrix elements. Both models should be reconvolved and compared to held-out data rather than judged only by their best fit to the original trace.
5. Test an equilibrium assumption
Section titled “5. Test an equilibrium assumption”A resistance anomaly shifts when the temperature sweep is accelerated and differs between warming and cooling. List the minimum checks before assigning an equilibrium phase boundary.
Solution
The observations indicate history dependence or thermal lag. At minimum:
- repeat several sweep rates and extrapolate toward a slow, settled limit;
- dwell at fixed temperatures while monitoring both sample and stage thermometry;
- reduce measurement current to test Joule heating;
- reset the sample through a reproducible thermal protocol;
- compare multiple contacts and samples;
- check for simultaneous structural, magnetic, or calorimetric signatures.
An equilibrium boundary should be quoted only after the settled result is separated from kinetic hysteresis and thermometer lag. If metastability is intrinsic, both branches and the protocol belong to the result.
6. Test a proposed topological interpretation
Section titled “6. Test a proposed topological interpretation”A surface-sensitive spectrum shows a gap and an in-gap state consistent with a proposed topological material. Choose three additional measurements that strengthen or falsify the claim, and explain their distinct roles.
Solution
One strong set is:
- bulk-sensitive spectroscopy or transport: tests whether the chemical potential and bulk gap are appropriate rather than properties of a reconstructed surface;
- surface-state dispersion under controlled termination or thickness: tests the predicted boundary connectivity and finite-size evolution rather than the mere presence of an in-gap feature;
- structure, symmetry, and composition characterization: verifies that the crystal and magnetic symmetry assumed by the topological classification are realized.
A fourth useful element is a response tied to the relevant invariant, with trivial bulk, surface, and contact mechanisms explicitly modeled. These measurements are valuable because their dominant systematic errors differ from those of the original surface spectrum.
Continue with a specific probe
Section titled “Continue with a specific probe”The chapter guide compares electrical, optical, scattering, imaging and thermodynamic measurements. Data Interpretation and Pitfalls develops comparisons between competing mechanisms; Computational Quantum Matter explains how to compare calculated observables with measured signals. For changing experimental claims, use the frontiers guide.
References
Section titled “References”- H. B. Callen and T. A. Welton, “Irreversibility and Generalized Noise,” Physical Review 83, 34–40 (1951), doi:10.1103/PhysRev.83.34.
- A. Damascelli, Z. Hussain, and Z.-X. Shen, “Angle-Resolved Photoemission Studies of the Cuprate Superconductors,” Reviews of Modern Physics 75, 473–541 (2003), doi:10.1103/RevModPhys.75.473.
- Joint Committee for Guides in Metrology, Evaluation of Measurement Data—Guide to the Expression of Uncertainty in Measurement, JCGM 100:2008 (2008), doi:10.59161/JCGM100-2008E.
- Joint Committee for Guides in Metrology, International Vocabulary of Metrology—Basic and General Concepts and Associated Terms, 3rd ed., JCGM 200:2012 (2012), official text. Accuracy, precision, resolution and measurement uncertainty.
- R. Kubo, “Statistical-Mechanical Theory of Irreversible Processes. I. General Theory and Simple Applications to Magnetic and Conduction Problems,” Journal of the Physical Society of Japan 12, 570–586 (1957), doi:10.1143/JPSJ.12.570.
- L. Van Hove, “Correlations in Space and Time and Born Approximation Scattering in Systems of Interacting Particles,” Physical Review 95, 249–262 (1954), doi:10.1103/PhysRev.95.249.