

Pump–Probe Spectroscopy
Pump–probe spectroscopy asks how a material changes after a controlled excitation. A pump pulse prepares a nonequilibrium state; a delayed probe pulse measures an observable; repeating the experiment while scanning the delay produces a time-resolved differential signal. The method can follow carrier redistribution, order-parameter suppression, energy transfer, coherent lattice motion, metastable switching, and driven states on time scales from attoseconds to seconds.
The word time-resolved does not make the measured trace a movie of one microscopic variable. The detector records a probe-dependent projection of a repeatedly prepared, spatially inhomogeneous, open system. Converting that record into a carrier temperature, quasiparticle density, phonon coordinate, gap, or transient phase requires a forward model and controls for pulse overlap, heating, penetration depth, repetition rate, matrix elements, and recovery between shots.
Required background. Ultrafast Spectroscopy supplies pulse preparation, delay scans and instrument-response limits. How Quantum Matter Is Measured supplies calibrated forward models and competing-explanation tests. Spectral Functions supplies the distinction between intrinsic transition strength and a probe-weighted spectral signal.
Time-resolved material response to optical pulses
Section titled “Time-resolved material response to optical pulses”An experiment has two separate ingredients: a prepared excitation and a probe that converts the resulting material response into a signal. This page follows both, from absorbed energy to optical, photoemission, and lattice measurements. Giannetti et al. give a broader review of ultrafast response in correlated materials. The pulse preparation and cross-correlation methods are introduced in the required background above.
Repeated preparation, not passive observation
Section titled “Repeated preparation, not passive observation”Most pump–probe experiments are stroboscopic. At every laser shot, a nominally identical pump prepares the sample, and one probe delay is sampled. A delay scan is assembled from many independently prepared trajectories. The measured point at delay is therefore an average over pulses, beam profiles, illuminated domains, detector integration time, and any slow drift:
This construction assumes reproducibility. If the material switches irreversibly, ages, accumulates defects, drifts thermally, or recovers more slowly than the pulse period, points acquired later in the scan need not represent the same initial state. Delay randomization, pump chopping, alternating reference shots, bidirectional scans, and explicit reset protocols test that assumption.
Let the repetition rate be . Full recovery requires more than the decay of the fastest optical transient. Electronic occupation, lattice temperature, strain, trapped charge, domains, and the cryostat mount can recover on very different time scales. A signal that is unchanged when is varied at fixed absorbed fluence is less likely to be dominated by cumulative heating, although it does not exclude single-pulse heating.
Incident fluence, absorbed fluence, and peak field
Section titled “Incident fluence, absorbed fluence, and peak field”For pulse energy and a spatial fluence profile ,
Quoting divided by an ill-defined spot area is not enough. A Gaussian beam with intensity radius has
Thus the peak fluence is twice . Check whether a quoted radius is a standard deviation, a full width at half maximum, a radius, or a radius.
For a thick, homogeneous sample at normal incidence with negligible transmission, a first absorption estimate is
where is the pump reflectance at the pump photon energy and polarization. The associated depth-dependent deposited energy density is
with pump absorption coefficient . If a fraction of absorbed photons produces the excitation being counted, then
These formulas are estimates, not universal calibrations. Thin films and heterostructures require multilayer absorption; anisotropic crystals require polarization-dependent optical constants; resonant saturation, nonlinear absorption, bleaching, and pump-induced changes can invalidate a linear Beer–Lambert profile.
For field-driven experiments, fluence alone can hide the relevant control parameter. For a plane wave in vacuum, a peak intensity corresponds to
before reflection, focusing, pulse-envelope, and in-medium corrections. Carrier injection often scales with absorbed photon number, whereas tunneling, nonlinear polarization, coherent control, and strong-field dressing can depend sensitively on peak electric field and carrier-envelope conditions.
Spatial averaging and depth mismatch
Section titled “Spatial averaging and depth mismatch”The pump and probe almost never weight the same volume. If the local response is and the probe sensitivity is , an illustrative model for an incoherently summed population signal is
For and ,
This positive weighting is appropriate only when local signal contributions add as intensities or populations. In reflection, fields emitted at different depths interfere. At a fixed optical frequency, with the state effectively constant during the probe, the linear change has the form
The complex optical kernel includes propagation and interfaces; it is not a positive probability weight. The exponential dilution factor cannot simply be used to invert reflected light. For the positive-weight model, a shallow pump and deep probe dilute the surface response. The same issue appears laterally because both beams have finite profiles and the probe integrates a continuum of local fluences. A sharp local threshold can become a broad measured onset. For concentric Gaussian pump and probe beams with radii , suppose a thin uniform layer changes by the same local amount wherever , and the detected change is proportional to the probe-weighted transformed area. The normalized signal is
Even a perfectly sharp local change does not produce a jump in this averaged signal. The seventh exercise derives this result. A larger pump relative to the probe makes the measured onset approach the local threshold.
The pump spot is commonly made larger than the probe spot, but a size ratio alone does not prove uniform excitation. Beam images at the sample, incidence-angle corrections, astigmatism, pointing stability, and the probe-weighted fluence distribution are all relevant.
Heating and nonthermal distributions
Section titled “Heating and nonthermal distributions”Immediately after optical absorption, the electronic distribution need not be describable by a temperature. Electron–electron scattering may establish a Fermi-like distribution before substantial energy reaches phonons, but that hierarchy is material-, energy-, and fluence-dependent. A fitted electronic temperature is meaningful only when the measured distribution is consistent with one over a stated energy range.
For a locally closed region that eventually equilibrates without changing volume, its final temperature follows from
Here is the volumetric heat capacity of the degrees of freedom included in the energy balance; a first-order transition also requires its latent heat. This is an estimate for that volume, not an upper bound on an early electronic temperature. Energy can initially occupy a much smaller electronic or mode-specific reservoir. Subsequent heat flow changes the energy within the illuminated region. An equilibrium temperature series helps test a thermal interpretation, but matching one spectral feature does not establish a thermal distribution. See Quantum Thermalization for the distinction.
Average absorbed power provides a separate heat load:
Varying fluence and repetition rate independently helps distinguish a response tied to energy per pulse from one tied to average heating. Base-temperature thermometry can still miss a hotter microscopic illuminated region.
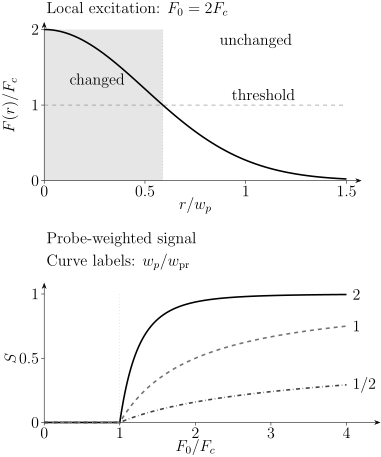
At , only the central region of a Gaussian pump exceeds the local threshold (top). The lower panel integrates the transformed region with a Gaussian probe. Its three curves differ only in the radius ratio ; the local threshold is identical. They describe a thin layer with additive, locally saturated contrast, not a general coherent reflection experiment.
Time-Resolved Reflectivity
Section titled “Time-Resolved Reflectivity”The measured ratio
Section titled “The measured ratio”In a common implementation, the pump is modulated and a photodiode plus lock-in amplifier measures the pump-induced change in reflected probe power. With the unpumped reflectance,
This ratio suppresses some laser noise, but it is not itself a microscopic population. At normal incidence on a homogeneous semi-infinite medium,
where is the complex refractive index. For a small pump-induced change and nonzero baseline amplitude,
The measured scalar therefore mixes the real and imaginary changes of , and hence of the complex dielectric function. The sign of is not universally the sign of carrier density, gap suppression, or temperature.
In a film, substrate, or heterostructure, is a multilayer amplitude containing propagation phases and interface coefficients. The same local can give opposite at different film thicknesses or probe wavelengths. A quantitative inversion should propagate a depth-dependent perturbation through a multilayer optical model rather than assign each exponential component directly to a microscopic species.
Spectral and polarization information
Section titled “Spectral and polarization information”A single-color trace records one projection of the transient dielectric function. Broadband probing instead measures
which helps distinguish a shifted resonance, broadened line, spectral-weight redistribution, and a nearly featureless background. Intensity-only broadband reflectivity still does not uniquely determine a complex dielectric function without additional phase information or model assumptions. Polarization-resolved measurements test anisotropy and symmetry. Comparison with equilibrium temperature, magnetic field, strain, or doping series helps identify whether the transient spectrum follows a known state manifold.
Global analysis can share physically common parameters across wavelengths and delays, but only if the model is identifiable. Singular-value decomposition can estimate the number of significant spectral components; it does not tell which component is a quasiparticle, phonon, or order parameter.
Time zero and coherent artifacts
Section titled “Time zero and coherent artifacts”Near temporal overlap, the pump and probe can mix through cross-phase modulation, two-photon absorption, stimulated Raman processes, scattered pump light, nonlinear response of a substrate, or electronic interference. Such a coherent artifact may be narrower than the material relaxation and may change with polarization or detection geometry.
The nominal translation-stage zero is not necessarily the sample time zero. Broadband probes have wavelength-dependent group delay, or chirp, so each detector pixel can correspond to a different effective delay. A reliable analysis measures or fits the instrument response, corrects the delay surface, and excludes or explicitly models overlap-dominated data. A sub-pulse-width spike should not be promoted to an intrinsic decay constant merely because an exponential fit accepts it.
Relaxation components are not identities
Section titled “Relaxation components are not identities”A causal sum of decays, valid after excitation,
can compress a dataset. Here is a delay-independent background offset; a persistent pump-induced change would instead begin with a step at time zero. The decays must be convolved with the instrument response before comparison near time zero. For a Gaussian response of standard deviation , one causal decay becomes
This follows by completing the square in , with a normalized Gaussian. The response is nonzero at negative nominal delays because pulses have finite duration; it does not describe a material reacting before excitation. For independent Gaussian pump/probe intensity envelopes and timing jitter, their temporal variances add to . Chirped or coherent-overlap signals may require a more detailed response model.
Even after convolution, the labels fast carriers, phonon cooling, and recombination do not follow from the fit. Distributed relaxation rates, diffusion, nonlinear kinetics, a changing spectrum, and convolution with the instrument response can all produce effective exponentials. Report parameter covariance, fit window, residuals, and whether the same parameters describe fluence, temperature, wavelength, and polarization dependences.
Time-Resolved ARPES
Section titled “Time-Resolved ARPES”What the probe adds
Section titled “What the probe adds”Time-resolved ARPES, commonly abbreviated trARPES, pumps the material and photoemits electrons with a delayed ultraviolet or extreme-ultraviolet probe. Compared with equilibrium ARPES, it can access transiently occupied states above the chemical potential, follow momentum-resolved population decay, track band and gap changes, and observe coherent energy or momentum shifts.
The equilibrium relation between intensity, matrix elements, spectral function, and occupation remains a useful guide,
but out of equilibrium there need not be a time-independent spectral function multiplied by a Fermi function. Use the lesser convention
For a weak probe after the pump field has vanished, a single-band model with constant photoemission matrix element samples this two-time correlation. For a real probe field envelope , the leading photoemission contribution is
Here is the sampled electronic energy, obtained by subtracting the probe carrier photon energy from the photoelectron energy and fixing the reference potential; is a field envelope, not its intensity. The factor converts into the occupied single-particle correlation. For a complex envelope, replace the product by in this convention. The finite temporal window means that a trARPES frame is not an instantaneous spectrum. When the system changes substantially during the probe pulse, a frame mixes different stages of the evolution. The sign and positivity can be checked by defining : the displayed intensity is proportional to .
During pump–probe overlap the same constant-, fixed- formula is not automatically gauge invariant. Pump-dependent transition matrix elements, momentum labeling, and propagation of outgoing electrons must be treated consistently. Freericks et al. (2009, corrected 2017) develop the finite-window description; their gauge analysis explains the additional overlap conditions. This distinction matters when interpreting sidebands as changes inside the solid.
Resolution and identifiability
Section titled “Resolution and identifiability”Shortening a transform-limited probe improves temporal resolution but broadens its spectrum. For a Gaussian pulse, with both widths measured as intensity full widths at half maximum,
The experiment also convolves pump duration, probe duration, timing jitter, analyzer resolution, photon bandwidth, and space-charge broadening. A claimed subcycle or few-femtosecond material response must be supported by an independently measured cross-correlation and an analysis compatible with the probe window.
Population above the chemical potential does not by itself reveal whether a band moved, a gap closed, a self-energy changed, or occupation was transferred into a pre-existing state. Energy-distribution and momentum-distribution cuts, full two-dimensional fits, equilibrium controls, and matrix-element variation with photon energy and polarization help separate those possibilities.
trARPES-specific artifacts
Section titled “trARPES-specific artifacts”Several effects can imitate electronic-structure dynamics:
- space charge: electrons emitted in one pulse repel one another, shifting and broadening the spectrum in a count-rate-dependent way;
- surface photovoltage: photoexcited carriers modify near-surface band bending, shifting spectral energies with material- and time-dependent recovery;
- pump-induced vacuum fields: emitted charge and the pump field can accelerate outgoing photoelectrons, producing delay-dependent energy or momentum shifts;
- laser-assisted photoemission: pump–probe overlap can dress the outgoing final state and create sidebands that are not intrinsic Floquet bands of the solid;
- chemical-potential and reference drift: sample charging, contact potentials, and analyzer drift can mimic a changing band energy;
- matrix-element dynamics: altered orbital character, polarization geometry, and final-state resonance can change intensity without a proportional change in occupation.
Count-rate scans test space charge; photon-energy and polarization changes test matrix elements and final-state effects; a grounded reference helps identify energy drift. The review by Boschini, Zonno, and Damascelli develops these experimental distinctions.
Coherent Phonons
Section titled “Coherent Phonons”A driven coordinate
Section titled “A driven coordinate”An ultrashort pump can launch a phase-coherent normal coordinate . A compact phenomenological equation that includes impulsive and displacive limits is
Here is the undamped angular frequency, is the oscillation-envelope decay rate in the underdamped regime, a pump-shifted equilibrium coordinate, and an impulsive stimulated-Raman force. A suddenly displaced equilibrium produces a cosine-like oscillation about the new position; an impulsive force produces a sine-like response in the ideal limits.
Reflectivity detects the coordinate through the optical susceptibility. To leading order,
The static derivative is real: changing its sign reverses the oscillation by , but does not produce an arbitrary phase rotation. A frequency-dependent detection kernel, depth-dependent propagation, or overlapping coordinates can add other phase shifts. Finite pulse duration and mixed forces also change the actual trajectory. Thus phase alone does not distinguish displacive excitation from impulsive stimulated Raman scattering. The driving and detection tensors are discussed by Stevens, Kuhl, and Merlin; Zeiger et al. develop the displacive limit.
Optical and acoustic modes
Section titled “Optical and acoustic modes”Zone-center Raman-active optical phonons are natural coherent modes because visible photons transfer little momentum. Their frequencies can be compared with equilibrium Raman and Optical Spectroscopy and eigenvectors from Phonons. Pump-polarization and crystal-symmetry dependence test the driving tensor, while probe-polarization dependence tests the detection tensor.
Absorption also launches strain through thermoelastic stress, deformation-potential coupling, or other electronic stress. A propagating acoustic pulse changes the optical phase and samples different depths as it moves. Oscillations from coherent acoustic phonons can therefore depend on probe wavelength and incidence angle rather than equal a fixed zone-center eigenfrequency. For a strain pulse moving normally into a weakly absorbing homogeneous medium, interference with the surface-reflected probe accumulates phase . With probe vacuum wavelength , real index , internal angle , and sound speed , this gives
Changing probe wavelength can therefore change the measured oscillation frequency even though the sound speed is unchanged. This is the picosecond acoustics mechanism treated by Thomsen et al.. Film echoes and substrate modes must be distinguished from optical phonons.
Frequency shifts and damping changes can reveal anharmonicity or coupling to electronic order, but a transient oscillation is not automatically the order parameter. Establishing coupling requires symmetry, fluence, temperature, and ideally mode-selective comparisons.
Relaxation Models
Section titled “Relaxation Models”Two-temperature model
Section titled “Two-temperature model”After sufficiently rapid internal equilibration, electrons and a lattice reservoir are sometimes assigned temperatures and . The two-temperature model then writes
Here are heat capacities per volume, has units , and have units . Adding the equations conserves the two-reservoir energy when source and loss vanish. For constant coefficients, subtracting the temperature equations gives
Only for does this approach . Both reservoirs reach in this closed, constant-capacity model. Allen connects electronic energy relaxation to electron–phonon coupling under specified metallic approximations. In a simple metal, the late-time electronic cooling rate can constrain electron–phonon energy transfer. In a correlated material, however, one thermal electron bath and one thermal lattice bath may be a poor description: selected phonons, spins, orbitals, and electronic sectors can exchange energy at distinct rates.
The model should not be applied before a temperature is identifiable. A non-Fermi electronic distribution cannot be made thermal merely by naming a fit parameter . Nor does agreement of one relaxation time establish a unique microscopic value of ; diffusion, depth averaging, temperature-dependent optical sensitivity, and finite pulse duration may be covariant with it.
Recombination bottlenecks
Section titled “Recombination bottlenecks”In a gapped system, recombination of two quasiparticles can create a boson energetic enough to break another pair. Rothwarf–Taylor-type rate equations describe the coupled quasiparticle density and high-energy boson density :
The equilibrium subtraction assumes the detailed rate balance . Adding the first equation to twice the second gives
Pair recombination and pair breaking redistribute excitation between the two populations; they cannot by themselves relax this combination. Slow removal of pair-breaking bosons can therefore delay quasiparticle recovery. This counts excitations in the rate model, not exact energy when the bosons and quasiparticles have broad energy distributions. Direct pump injection into the boson reservoir would require an additional source in its equation. These conventions follow the pair-counting mechanism of Rothwarf and Taylor.
Here is a bimolecular recombination coefficient, a pair-breaking rate, and equilibrium densities, and an effective boson escape or decay time. The equations can explain nonlinear amplitude and lifetime trends, but a successful fit does not uniquely establish superconducting quasiparticles. Other gapped excitations and nonlinear population kinetics can generate similar traces. An inferred gap should agree with spectroscopy, temperature and field scales, and the proposed ordered state.
Diffusion and geometry
Section titled “Diffusion and geometry”Carrier or heat transport can dominate long delays. A scalar density may obey
Even if the local decay is exponential, diffusion out of the probe volume produces a nonexponential measured signal. Conversely, a finite delay window can make diffusion appear exponential. Spot-size variation is a direct diagnostic: intrinsic local kinetics should not acquire the spatial scaling expected for diffusion. In thin films, interface thermal resistance and substrate heat flow become essential at longer delays.
Light-Induced States and Phases
Section titled “Light-Induced States and Phases”Distinct routes away from equilibrium
Section titled “Distinct routes away from equilibrium”Light can change a material through several mechanisms:
- population redistribution: carriers are promoted between bands or among valleys, orbitals, and spins;
- screening and interaction renormalization: excited carriers alter self-energies, exciton binding, exchange, or effective interactions;
- order-parameter suppression or competition: heating or nonequilibrium populations weaken one order and expose another;
- coherent lattice control: an infrared or Raman mode displaces atoms and modifies hopping, crystal fields, or exchange;
- periodic dressing: a sufficiently coherent drive can produce Floquet-like sidebands or effective couplings during the field;
- metastable trapping: the pulse carries the system across a barrier into a long-lived configuration;
- field-driven motion: a strong electric field accelerates carriers, drives tunneling, or moves domains without primarily acting as a photon counter.
These mechanisms can coexist. A mid-infrared pulse resonant with a phonon also deposits heat, changes electronic screening, and may drive nonlinear lattice coordinates. A visible pulse that melts charge order can simultaneously alter the lattice and quasiparticle distribution. Mechanism claims require scaling tests that distinguish absorbed energy, photon energy, peak field, polarization, pulse duration, and resonance.
What counts as a phase?
Section titled “What counts as a phase?”In equilibrium, a phase is identified by a stable macroscopic state, often with an order parameter, broken symmetry, topological invariant, rigidity, or characteristic response. A driven open system need not admit an equilibrium free energy or temperature, so the phrase light-induced phase must be operationally defined.
A strong claim should specify:
- the defining observable and its relation to an order parameter, symmetry, topology, or rigidity;
- whether the state exists only during pump–probe overlap, persists after the field, or is metastable;
- the spatial fraction and depth profile of the transformed region;
- the lifetime relative to microscopic equilibration and probe resolution;
- whether the response is distinct from any equilibrium heated state;
- how the state is reset, whether cycling is reversible, and whether damage accumulates;
- which independent probe confirms the same state.
Terms such as transient state, driven response, photoinduced population, or metastable state are often more accurate than phase when only one optical signature is available.
Conductivity during a changing state
Section titled “Conductivity during a changing state”An optical edge or a positive low-frequency inductive response need not imply superconductivity. A sufficiently narrow normal Drude response also has above its scattering rate. Moreover, a changing material responds at two times:
Only a stationary kernel depends on alone. If the state changes appreciably during the probe, dividing two Fourier-transformed fields does not in general recover an instantaneous equilibrium-like conductivity. Orenstein and Dodge demonstrate this distinction for transient conducting states. A slowly evolving state can admit an approximate snapshot, but its lifetime must be compared with the probe duration and the response memory, not just the nominal delay step.
To connect a transient optical signature to a collective state, combine its complex frequency response with a depth-dependent optical model and an independent response to phase coherence or rigidity. Test ordinary carrier narrowing, lattice resonances, and heating in the same geometry. The terahertz discussion explains the equilibrium electrodynamic limits; de la Torre et al. review mechanisms of ultrafast material control.
A state that survives after the pulse differs from a response sustained only by a periodic drive. Lack of persistence does not invalidate an explicitly driven interpretation; see Floquet Quantum Matter. Likewise, speed alone does not define a nonthermal state. A rapidly formed hot electron distribution can be thermal within its electronic sector, while a slower mode-selective population can remain nonthermal.
What each observable can tell you
Section titled “What each observable can tell you”| Reported quantity | Directly constrained by | Requires in addition |
|---|---|---|
| Differential reflected probe power | Baseline , linearity, overlap and scatter controls | |
| Broadband amplitude and phase or a constrained optical inversion | Multilayer geometry, depth profile, causal model | |
| Electronic temperature | Momentum- and energy-resolved occupation compatible with a Fermi function | Resolution convolution and chemical-potential tracking |
| Quasiparticle density | Population-sensitive observable under a kinetic model | Matrix elements, gap model, calibration and competing channels |
| Phonon coordinate | Oscillation plus known optical sensitivity | Mode eigenvector, driving and detection tensors |
| Transient gap | Resolved spectral leading edge, coherence feature, or conductivity threshold | Resolution, occupation, self-energy and nonequilibrium model |
| Light-induced phase | State-defining symmetry, rigidity, topology, or order response | Depth, lifetime, thermal controls, orthogonal confirmation |
Exercises
Section titled “Exercises”1. Estimate the excitation density
Section titled “1. Estimate the excitation density”An pump with photon energy has incident fluence . A bulk sample reflects and has pump penetration depth . Neglect transmission and take one excitation per absorbed photon. Find the absorbed fluence, surface energy density, and surface excitation density.
Solution
The incident fluence is
Therefore
The absorption coefficient is , so
Using ,
This is a surface estimate. The density decays exponentially and would need quantum-efficiency and nonlinear-absorption corrections in a real material.
2. Quantify depth dilution
Section titled “2. Quantify depth dilution”A pump has penetration depth and the probe sensitivity decays over . For the exponential model used above, what fraction of the surface response appears in the normalized measured signal?
Solution
The pump absorption and the stipulated positive probe-sensitivity decay coefficients are
The depth factor is
Only one sixth of the local surface amplitude appears under this model. Interpreting the measured amplitude as a uniform bulk response would underestimate the transformed surface region.
3. Linearize a reflectivity change
Section titled “3. Linearize a reflectivity change”A nonabsorbing material has baseline refractive index . A pump produces . Estimate to first order at normal incidence.
Solution
The baseline amplitude is
Differentiating gives
Hence
The predicted reflectivity increase is . The imaginary part affects the field but makes no first-order contribution for this real baseline ; that simplification is not generic.
4. Time–energy tradeoff in trARPES
Section titled “4. Time–energy tradeoff in trARPES”A transform-limited Gaussian photoemission probe has an intensity duration of . Estimate its minimum energy bandwidth. What pulse duration would be required for a bandwidth?
Solution
Using and ,
The Gaussian relation is discussed by Diels and Rudolph. The transform-limited bandwidth is about before analyzer and harmonic-source broadening. For ,
Real resolution is worse after all independent broadening terms are included.
5. Distinguish ideal coherent-phonon phases
Section titled “5. Distinguish ideal coherent-phonon phases”Solve the undamped oscillator for two idealized cases: (a) the equilibrium position suddenly changes from to at ; (b) a delta-function impulse gives initial velocity while the equilibrium remains at zero. Take before either excitation.
Solution
For the sudden displacement,
with , giving
For an impulse, and , so
The ideal displacive response is cosine-like about a shifted equilibrium, whereas the impulsive response is sine-like. In measured reflectivity, finite pulse width, damping, chirp, mixed forces, and a dynamic detection kernel can rotate the apparent phase; a real static sensitivity alone only changes the sign, so phase alone does not prove the mechanism.
6. Separate per-pulse and average heating
Section titled “6. Separate per-pulse and average heating”A pump has incident peak fluence and a measured spatial profile with effective area
The absorbed fraction is . Estimate the absorbed energy per pulse and average absorbed power at and .
Solution
The incident fluence is , so
Using the stated effective area,
Thus
The nominal absorbed fluence per pulse is unchanged, while average heating differs by a factor of . A response that changes between these conditions has not been shown to depend on per-pulse excitation alone.
7. Recover a local threshold from Gaussian beams
Section titled “7. Recover a local threshold from Gaussian beams”A thin layer has local contrast when and otherwise. The pump fluence is and the measured contrast is the average weighted by probe intensity . Derive and find the peak fluence at which . Compare . Assume concentric circular beams, a uniform layer, no depth variation, and additive contrast.
Solution
For , the transformed disk has radius
The radial area element is , so
At or below threshold the transformed area is zero. Half contrast occurs at , giving , , and for the three radius ratios. Assigning the half-height of an averaged trace to the local threshold can therefore produce a large error even with noiseless data. The result changes if contrast grows with local fluence, the layer varies with depth, or the probe coherently sums amplitudes.
References
Section titled “References”- P. B. Allen, “Theory of Thermal Relaxation of Electrons in Metals,” Physical Review Letters 59, 1460–1463 (1987), doi:10.1103/PhysRevLett.59.1460.
- F. Boschini, M. Zonno, and A. Damascelli, “Time-Resolved ARPES Studies of Quantum Materials,” Reviews of Modern Physics 96, 015003 (2024), doi:10.1103/RevModPhys.96.015003.
- A. de la Torre et al., “Colloquium: Nonthermal Pathways to Ultrafast Control in Quantum Materials,” Reviews of Modern Physics 93, 041002 (2021), doi:10.1103/RevModPhys.93.041002.
- J.-C. Diels and W. Rudolph, Ultrashort Laser Pulse Phenomena, 2nd ed. (Academic Press, 2006), doi:10.1016/B978-0-12-215493-5.X5000-9.
- J. K. Freericks, H. R. Krishnamurthy, and Th. Pruschke, “Theoretical Description of Time-Resolved Photoemission Spectroscopy: Application to Pump–Probe Experiments,” Physical Review Letters 102, 136401 (2009), doi:10.1103/PhysRevLett.102.136401; erratum 119, 189903 (2017), doi:10.1103/PhysRevLett.119.189903.
- J. K. Freericks, H. R. Krishnamurthy, M. A. Sentef, and T. P. Devereaux, “Gauge Invariance in the Theoretical Description of Time-Resolved Angle-Resolved Pump/Probe Photoemission Spectroscopy,” Physica Scripta T165, 014012 (2015), doi:10.1088/0031-8949/2015/T165/014012.
- C. Giannetti et al., “Ultrafast Optical Spectroscopy of Strongly Correlated Materials and High-Temperature Superconductors: A Non-Equilibrium Approach,” Advances in Physics 65, 58–238 (2016), doi:10.1080/00018732.2016.1194044.
- J. Orenstein and J. S. Dodge, “Terahertz Time-Domain Spectroscopy of Transient Metallic and Superconducting States,” Physical Review B 92, 134507 (2015), doi:10.1103/PhysRevB.92.134507.
- A. Rothwarf and B. N. Taylor, “Measurement of Recombination Lifetimes in Superconductors,” Physical Review Letters 19, 27–30 (1967), doi:10.1103/PhysRevLett.19.27.
- T. E. Stevens, J. Kuhl, and R. Merlin, “Coherent Phonon Generation and the Two Stimulated Raman Tensors,” Physical Review B 65, 144304 (2002), doi:10.1103/PhysRevB.65.144304.
- C. Thomsen, H. T. Grahn, H. J. Maris, and J. Tauc, “Surface Generation and Detection of Phonons by Picosecond Light Pulses,” Physical Review B 34, 4129–4138 (1986), doi:10.1103/PhysRevB.34.4129.
- H. J. Zeiger et al., “Theory for Displacive Excitation of Coherent Phonons,” Physical Review B 45, 768–778 (1992), doi:10.1103/PhysRevB.45.768.