

Raman and Optical Spectroscopy
Raman spectroscopy measures the small energy difference between an incident photon and a scattered photon after the material is left in a different state. In a crystal, that final state need not be a molecular vibration. It can be a zone-center phonon, two magnons with nearly opposite momenta, a crystal-field excitation, an electronic particle-hole continuum, a superconducting pair-breaking excitation, or a collective mode. Incident and analyzed photon polarizations select symmetry channels, giving Raman scattering a form of momentum-space and operator selectivity even though visible photons transfer little crystal momentum.
That selectivity is conditional. The detected intensity also depends on laser energy, resonance, absorption depth, refractive index, crystal orientation, domains, numerical aperture, polarization leakage, spectrograph response, fluorescence, substrate interference, and laser-induced heating. A peak can establish an excitation energy in one optical channel; it does not automatically identify the microscopic mode or measure its unweighted density of states.
A useful first question is: what change in the material could leave this photon with the observed energy and polarization? The next is whether the same assignment explains how the line changes with angle, temperature, field, and laser energy. This page develops those comparisons for crystals and thin materials.
Required background. Raman Spectroscopy supplies inelastic light scattering, polarizability and polarization selection rules. Susceptibilities supplies the source, detector and channel normalization of a material response. How Quantum Matter Is Measured supplies intensity calibration, resolution and the tests needed to connect an observed line to a material excitation.
What Raman measures in a crystal
Section titled “What Raman measures in a crystal”A spectrum records scattered photons, whereas a phonon frequency, magnetic exchange scale, or electronic relaxation rate is inferred from a model of their interaction with the sample. The molecular Raman introduction derives the scattering amplitude and population factors. Here the emphasis is on crystal symmetry, the excitation selected by each polarization, and how optical propagation changes the observed signal. Terahertz and infrared probes treats the complementary dielectric and current response.
Energy and momentum transfer
Section titled “Energy and momentum transfer”Let the incident laser have angular frequency and wavevector , and let the detected photon have and . Use positive Raman loss
for Stokes scattering, and define
Visible photon momenta are small compared with a typical Brillouin-zone dimension. Even in backscattering,
where is the vacuum wavelength. This estimate uses a transparent, approximately isotropic medium, a small fractional Raman shift, and a common real refractive index for the two photons. More generally, backscattering gives with their distinct internal wavevectors. The physical momentum transfer is . Strong absorption limits the depth and broadens the normal-wavevector selection; anisotropy requires the appropriate optical modes.
This does not limit every Raman feature to a zone-center elementary excitation. A two-particle process can create momenta and whose total matches the small photon transfer. Disorder and edges can supply missing momentum, while superlattices change the reciprocal lattice and finite size broadens momentum selection. Resonance changes the amplitude, not the requirement to conserve total crystal momentum: a double-resonant feature still needs the appropriate additional phonon, defect, or other momentum-carrying process.
Response-function form
Section titled “Response-function form”For a nonresonant channel whose effective material operator is Hermitian, use the physical response to a source . With the forward transform , define
The label contains the incident energy, polarizations, propagation geometry, and microscopic Raman vertex. Set , which is nonnegative at positive frequency in equilibrium for this Hermitian channel. First include the population and optical factors in a spectrum :
The instrument broadens that spectrum and adds background:
is the normalized instrument line shape, contains optical throughput and any overall normalization not already included in , is the Bose function, and is background. The vertex determining the relative weights of material transitions belongs in ; it must not be counted a second time in . The equation is a reduction, not a universal absolute cross section. A retarded-correlator convention with instead requires the loss function ; that sign must not be mixed with the physical-response convention used here.
For a complex effective vertex, the transition probability involves the adjoint channel,
The corresponding adjoint-channel commutator uses . This is a cross response; a physical driving Hamiltonian includes a source and its Hermitian conjugate. Replacing the adjoint by the same operator, or comparing the two frequency signs in one unchanged channel, requires additional symmetry.
For a Hermitian equilibrium channel, the definitions above give, at nonzero frequency,
Elastic weight at zero frequency is a separate contribution. Near electronic resonance, the vertex itself can vary strongly across a Raman band and the effective-operator approximation may need to be replaced by the full intermediate-state amplitude. The fluctuation–dissipation theorem explains this population factor. The electronic-scattering treatment of Devereaux and Hackl develops the polarization vertices and screening.
The common Bose correction
is justified only after dark, response, background, and temperature-dependent optical factors are controlled. Dividing raw counts by does not remove fluorescence, resonant enhancement, or laser heating.
Raman Selection Rules in Materials
Section titled “Raman Selection Rules in Materials”From the space group to the Raman tensor
Section titled “From the space group to the Raman tensor”At the Brillouin-zone center, a phonon transforms under an irreducible representation of the crystal little group. The leading electric-dipole Raman tensor is a derivative of the optical susceptibility with respect to the mode coordinate:
In the ordinary nonresonant electric-dipole, symmetric-polarizability approximation, the mode is allowed when its representation occurs in the symmetric second-rank tensor built from electric-field components. This statement does not cover every magnetic or resonant scattering operator; antisymmetric tensor components can then matter. Its intensity in an ideal fixed geometry is
The normal-mode classification is developed by Rousseau, Bauman, and Porto. Group theory determines allowed tensor components and exact zeros within a stated symmetry and operator approximation. It does not determine their numerical magnitudes, resonance profile, linewidth, or signal-to-background ratio.
The relevant symmetry is the actual ordered structure at the measurement temperature and field. A structural, magnetic, nematic, or charge-order transition can lower the point group, split degeneracies, activate folded modes, or mix tensors. Conversely, strain, defects, surfaces, and finite domains can produce weak nominally forbidden intensity without a bulk phase transition.
Tetragonal in-plane example
Section titled “Tetragonal in-plane example”For a representative crystal with axes , , and , convenient symmetric tensors are
For propagation near and in-plane linear polarization, restricting to these symmetric tensors gives:
| Geometry | Ideal symmetry content |
|---|---|
| with | |
| with |
The labels add spectral weights from distinct symmetry sectors in a symmetry-preserving equilibrium sample; they are not amplitudes of one common final state. A general antisymmetric tensor contributes to both crossed configurations, so and need not isolate and in a resonant electronic experiment. Combining linear and circular configurations can separate more components. Subtracting spectra requires calibrated throughput, tensor normalization, and leakage.
To see what a rotation does, set the incident polarization to and use either the same analyzer direction or the perpendicular direction . Matrix multiplication gives
For the corresponding amplitudes are and zero. Rotating both polarizations by takes to , or to up to an irrelevant sign of the analyzer vector. Crossing the analyzer with the incident polarization held fixed is a different operation.
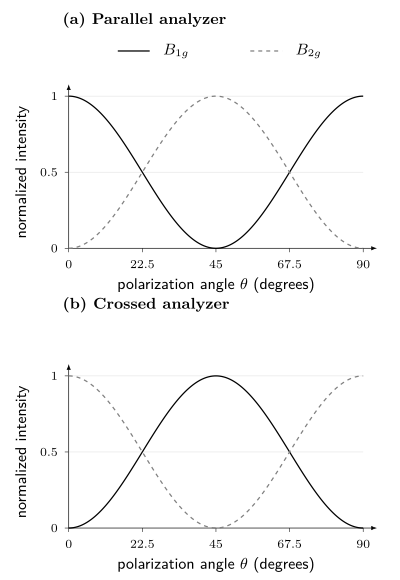
Squared tensor amplitudes for separate and modes, each divided by its own nonzero tensor coefficient squared. The angle is measured from the crystal axis. A joint rotation exchanges the two patterns; changing from parallel to crossed polarization does so at a fixed angle. These ideal curves exclude antisymmetric channels, domains, birefringence, and leakage. They predict angular shapes, not equal absolute strengths of different modes.
Geometry must be reproducible
Section titled “Geometry must be reproducible”Porto notation writes a configuration as
For example, denotes backscattering along , with incident polarization along and analyzed scattered polarization along . A report should also state whether axes are laboratory, crystallographic, or sample-edge directions; how a miscut was measured; whether the analyzer was before or after a depolarizing optical element; and how the objective changes polarization.
Ideal extinction can be spoiled by:
- finite numerical aperture and longitudinal focal fields;
- birefringence and depth-dependent polarization;
- dichroism and different penetration depths for the two polarizations;
- objective, grating, mirror, and detector polarization response;
- imperfect polarizers and analyzer rotation offsets;
- twinning, rotational domains, mosaicity, and surface miscut;
- depolarization by roughness or multiple scattering.
Measure intensity leakage with a reference whose allowed channels are known. Coherent polarization mixing may require a Jones or Mueller description rather than a scalar subtraction. Misorientation alone produces crossed intensity proportional to near nominal , with in radians. A error therefore gives about of that mode’s maximum intensity even with perfect polarizers. In optically anisotropic crystals, propagation can also change the polarization with depth; Kranert and collaborators treat this explicitly.
Phonons
Section titled “Phonons”First-order spectra probe the zone center
Section titled “First-order spectra probe the zone center”For a perfect crystal, first-order Raman scattering creates or annihilates one phonon with wavevector close to the photon transfer. Because , it selects zone-center optical modes in an ordinary visible experiment. Acoustic modes approach zero frequency there and are usually studied by Brillouin scattering rather than a conventional Raman spectrograph.
The number and symmetry of Raman-active modes constrain the crystal structure. Useful signatures include:
- splitting of a degenerate representation under lowered symmetry;
- appearance of folded modes when a supercell forms;
- softening and linewidth growth near a structural instability;
- discontinuous frequency or intensity changes across a first-order transition;
- isotope shifts that test vibrational assignment;
- polarization rotation that identifies tensor components;
- spatial maps that reveal domains, strain, composition, or phase coexistence.
None is uniquely structural on its own. Electronic resonance can change intensity; strain can split modes; heating can soften them; and disorder can activate otherwise forbidden momentum.
Second-order and disorder-assisted features
Section titled “Second-order and disorder-assisted features”Two-phonon Raman scattering can create phonons with approximately opposite momenta, so it samples weighted joint densities throughout the Brillouin zone. Defect-assisted processes can supply missing momentum. In graphene, the D band is defect activated, while the 2D band is a two-phonon double-resonant process that does not require a defect. These labels describe specific scattering pathways, not generic “first” and “second” overtones.
Assigning a broad band to a phonon density of states requires calculated dispersion, eigenvectors, resonance denominators, and matrix elements. A peak in a two-phonon spectrum can arise from a critical point, but its intensity is not the unweighted density of states.
Frequency, width, and Fano interference
Section titled “Frequency, width, and Fano interference”An isolated damped phonon is often fitted with a Lorentzian or a resolution-convolved Voigt profile. Frequency shifts and linewidths can reflect thermal expansion, anharmonic decay, electron–phonon coupling, spin–phonon coupling, isotope disorder, strain distribution, or phase coexistence. A lifetime conversion needs a decay model. If the mode coherence decays as , its isolated Lorentzian has angular-frequency FWHM . Only when energy relaxation is the sole damping mechanism does , giving FWHM for population lifetime . Pure dephasing or unresolved static frequency differences break that last identification. If the width is reported in , convert it to angular frequency with , using in . Balkanski, Wallis, and Haro give a standard anharmonic phonon example.
If a discrete phonon interferes with a continuum, a Fano profile may be appropriate:
where
is real in this elementary coherent-interference model, and is the half-width scale of its resonant denominator. It is generally not the half width measured from the asymmetric intensity peak. Writing the scattering amplitude as shows a direct continuum path interfering with a resonant path. The sign of changes if the detuning convention is reversed. Additional unresolved channels or complex relative phases can lift the zero. An asymmetric fit alone neither identifies the continuum nor excludes overlapping ordinary peaks; the original model is Fano (1961).
Thermometry and laser heating
Section titled “Thermometry and laser heating”Raman peak shifts, linewidths, and Stokes-to-anti-Stokes ratios can estimate temperature. Each is conditional:
- a frequency thermometer requires a phase- and strain-specific calibration;
- linewidth thermometry assumes the same decay channels;
- intensity-ratio thermometry requires relative spectral response, polarization, resonance, and the scattered-frequency factor;
- all three can disagree when optical and acoustic subsystems are out of equilibrium.
For nonresonant Stokes/anti-Stokes thermometry with equal transition tensors, a calibrated photon-count ratio contains a third power of the scattered-frequency ratio; a radiant-power ratio contains a fourth power. The Raman thermometry derivation explains the conversion. Different optical-stack enhancement or resonant tensors on the two sides require further corrections. A ratio can estimate a mode occupation without proving that the entire sample has one temperature.
Measure spectra versus absorbed power, not only nominal power. Spot size, reflectance, substrate heat sinking, encapsulation, and environmental gas determine temperature rise. Extrapolation to zero power is often more trustworthy than declaring the lowest available power “nonheating.”
Magnons and Magnetic Continua
Section titled “Magnons and Magnetic Continua”Visible photons carry little momentum, but exchange-mediated Raman scattering can create two magnetic excitations with nearly opposite momenta. For a nonresonant, single-orbital Mott insulator reduced to a Heisenberg model, a representative Fleury–Loudon operator, up to a common optical prefactor, is
Here is a unit bond direction and is dimensionless. Identifying the bond coefficient with assumes the same virtual processes and optical prefactor for the relevant bonds; it is not a universal resonant or multiorbital identity. Fleury and Loudon and Shastry and Shraiman develop these magnetic scattering mechanisms. The polarization dependence weights exchange bonds and transforms as a crystal symmetry channel. A two-magnon band can therefore sample exchange energies from across the magnetic Brillouin zone even though the total transferred momentum is nearly zero.
For an isotropic nearest-neighbor square-lattice model, the fully symmetric Fleury–Loudon combination is proportional to the Hamiltonian itself. It has no finite-energy matrix elements between its eigenstates, so its inelastic response vanishes in that model. This is stronger than a point-group allowance: a symmetry-allowed tensor need not produce a spectrum. The difference of horizontal and vertical bond energies is not conserved and can scatter inelastically.
The scalar exchange operator also has no term linear in a transverse fluctuation about a collinear ordered state, explaining the absence of a one-magnon signal in this approximation. Spin–orbit or magnetic-dipole vertices, noncollinear order, and other changes to the coupling can alter that conclusion. Resonance or broken inversion by itself is not a universal permission rule; the actual operator and magnetic symmetry decide which matrix elements survive.
A magnetic Raman continuum may arise from:
- interacting or short-lived magnons;
- two- or multi-magnon states;
- spinons or other fractional excitations;
- disorder and random exchange;
- phonon or luminescence background;
- electronic particle-hole excitations.
Broad polarization-dependent weight that survives where phonons are excluded is valuable evidence, but it is not by itself a complete spin-liquid diagnosis. Compare field and temperature dependence, symmetry channels, energy sum scales, neutron spectra, thermodynamics, and a microscopic Raman operator.
Electronic Raman Response
Section titled “Electronic Raman Response”Effective density vertex
Section titled “Effective density vertex”In a nonresonant single-band effective-mass approximation, the electronic Raman operator can be written
with a dimensionless vertex (physical wavevectors , free electron mass )
This shows how polarization weights different regions of an anisotropic band. It is not exact in a multiband or resonant material: interband matrix elements, vertex corrections, spin–orbit coupling, and intermediate-state denominators can dominate.
For a perfectly clean, noninteracting band at exactly zero momentum transfer, each occupation is conserved. This operator then has no finite-frequency response. Angular weights alone do not create a continuum: interactions, scattering, finite transferred momentum, or additional interband processes must provide transitions or relaxation.
For a tetragonal electronic structure, common basis functions are
Here is the in-plane lattice spacing. These are allowed shapes, not guaranteed nonzero vertices. For , the mixed second derivative vanishes, so the effective-mass vertex is zero; diagonal hopping can make it nonzero. In cuprate-like band structures the two shapes are often described as emphasizing antinodal and nodal sectors, respectively. That language is a material-dependent shorthand, not a universal theorem about the irrep labels.
Screening and the fully symmetric channel
Section titled “Screening and the fully symmetric channel”The fully symmetric channel can change the total density, which creates an electric field opposing that change. Other angular variations can redistribute charge while adding to zero overall. This distinction explains why Coulomb screening need not remove all scattering.
For a scalar density channel at finite , write for responses irreducible with respect to the Coulomb interaction, using the positive physical-response convention above. Let be normalized so that is an induced one-particle energy. A source induces
Solving the first equation and substituting into the second gives
The familiar subtraction is the strong-screening limit , away from a collective pole. It is not a formula to evaluate by setting and dividing by a vanishing density response. For a constant vertex, the full result reduces to the screened density response; at exactly zero momentum the total number commutes with a number-conserving Hamiltonian and gives no finite-frequency inelastic weight. Finite-momentum plasmons and the order of the frequency/momentum limits remain physical.
In an unbroken tetragonal phase, nonsymmetric vertices have zero overlap with the scalar density by symmetry at zero momentum. A nonconstant vertex, multiband relative-density modes, or lowered symmetry requires more care. Multilayer Coulomb response uses matrices rather than this one-channel scalar expression. The signs in the denominator follow the stated source convention; they reverse with some commonly used density-correlator definitions.
What electronic features can mean
Section titled “What electronic features can mean”Electronic Raman spectra can show:
| Feature | Possible interpretation | What to distinguish |
|---|---|---|
| broad low-energy continuum | incoherent carriers, particle-hole excitations, or magnetic weight | fluorescence and luminescence subtraction |
| collision-dominated peak | symmetry-resolved electronic relaxation | vertex corrections and hydrodynamic limits |
| gap depletion and edge | density-wave, superconducting, or insulating gap | final-state interactions and momentum weighting |
| pair-breaking peak | superconducting quasiparticles in one symmetry channel | not generally equal to |
| sharp in-gap mode | exciton, amplitude mode, Leggett mode, or bound state | symmetry and many-body selection rules |
| quasielastic peak | slow order-parameter fluctuations | laser heating and central-Rayleigh tails |
Electronic Raman response is a two-particle correlator. Tunneling probes a weighted single-particle local spectrum, photoemission a momentum-resolved removal spectrum, and optical conductivity a current response. These observables are different; photoemission is not generally a density-of-states measurement. Cross-probe comparison requires a common Hamiltonian with each probe’s vertex.
Resonance and Optical Complements
Section titled “Resonance and Optical Complements”Resonant Raman scattering
Section titled “Resonant Raman scattering”When approaches an allowed electronic transition, one or more intermediate-state denominators become small. Intensities can increase dramatically and previously weak pathways can dominate. The Raman tensor then becomes complex and strongly dependent on incident energy, and the Placzek derivative picture may fail.
A resonance profile should be measured by changing laser energy while controlling:
- photon flux and focus;
- objective and grating throughput;
- penetration depth and optical interference;
- absorption and local heating;
- fluorescence background;
- detector response at the shifted wavelengths;
- sample position and damage history.
A peak that appears only at one laser energy may be resonantly enhanced rather than absent elsewhere. Conversely, destructive quantum interference can suppress a channel at a particular excitation energy.
Raman is not every optical spectrum
Section titled “Raman is not every optical spectrum”| Method or quantity | What is measured | What it probes |
|---|---|---|
| Raman scattering | photon counts versus energy loss | symmetry-resolved inelastic scattering response |
| absorption or transmission | removed or transmitted optical power | dielectric response plus propagation |
| reflectance | reflected power or field ratio | Fresnel response of surfaces and layer stack |
| ellipsometry | complex polarization ratio | model-dependent complex dielectric function |
| photoluminescence | spontaneous emission spectrum | occupied excited states, radiative matrix elements, and kinetics |
| optical conductivity | inferred complex current response | current-current susceptibility and diamagnetic term |
Photoluminescence can overlap a Raman spectrum but has different laser-energy dependence: Raman features remain at approximately fixed shift, whereas fluorescence features often remain closer to fixed emission energy. This diagnostic is useful but not infallible near dispersive double-resonant features or strongly changing excitation profiles.
Reflectance, transmission, and ellipsometry can identify excitons, interband transitions, and absorption edges that explain a Raman resonance. Their inversion requires Fresnel or transfer-matrix modeling and, for conductivity, causality and sum-rule checks. They should constrain the Raman vertex rather than be relabeled as Raman data.
Low-Dimensional Materials
Section titled “Low-Dimensional Materials”Micro-Raman spectroscopy is attractive for flakes and heterostructures because it is contactless, diffraction limited, and compatible with mapping. The small sample volume also magnifies optical and thermal systematics.
Substrate and layer-stack interference
Section titled “Substrate and layer-stack interference”The field at an atomically thin layer is the coherent sum of incident and reflected waves. Scattered light also reflects and transmits through the stack. For statistically independent source regions, a band area can be modeled as
denotes the collection-mode field propagated back into the sample by reciprocity, with the appropriate polarization and normalization; it is not a second independent illumination beam. The depth integral assumes the relevant source correlations are local. A collective mode with coherent amplitudes across several layers instead requires a double integral over of the source correlation, including optical phases. Thus fields interfere within the stack even when intensities from independent emitters add.
The enhancement depends on oxide thickness, refractive indices, numerical aperture, excitation wavelength, Raman shift, and layer position. Yoon and collaborators demonstrate this effect for graphene on an oxide/silicon stack. Raw intensity ratios measured on different substrates are not intrinsic material ratios. A transfer-matrix calculation should use measured layer thicknesses and optical constants with uncertainty.
Graphene and related carbon systems
Section titled “Graphene and related carbon systems”The G band is a zone-center optical phonon. The D band is defect activated through a double-resonant intervalley process. The 2D band is a two-phonon double-resonant feature and can be strong in clean material. Their positions, widths, shapes, dispersions with laser energy, and intensity ratios constrain layer structure, strain, doping, disorder, and electronic lifetime through coupled models; see Ferrari and Basko.
Correlated changes are more reliable than one empirical threshold. Strain and carrier density can both shift the G and 2D bands but along different trajectories in a calibrated two-frequency plot. Edge orientation, substrate interference, laser energy, and finite spot size must accompany any defect-density or layer-number inference.
Transition-metal dichalcogenides and heterostructures
Section titled “Transition-metal dichalcogenides and heterostructures”In monolayer transition-metal dichalcogenides, reduced symmetry changes mode labels and optical selection rules. In-plane and out-of-plane phonons shift differently with layer number, strain, doping, dielectric environment, and temperature. For semiconducting group-VI compounds such as MoS, photoluminescence can reveal the crossover from an indirect bulk gap to a bright direct monolayer transition, while Raman constrains lattice symmetry and coupling. This is not a claim about every transition-metal dichalcogenide, crystal phase, or heterostructure; representative MoS measurements are Lee et al. and Mak et al..
Low-frequency shear and layer-breathing modes are especially sensitive to layer number, stacking, twist, and interlayer force constants. Folded phonons or moiré-activated features can indicate superlattice reconstruction, but contamination bubbles, strain gradients, rotational domains, and ordinary combination modes are alternatives.
For an anisotropic flake, record crystallographic orientation, edge assignment, incident and analyzed polarization, encapsulation, substrate, and transfer history. A polar plot without the optical-stack and birefringence model is not yet a Raman tensor.
Instrument, Calibration, and Mapping
Section titled “Instrument, Calibration, and Mapping”Minimal material microscope
Section titled “Minimal material microscope”A typical micro-Raman system contains a narrow-line laser, cleanup filter, power control, polarization optics, microscope objective, sample stage and environment, Rayleigh-rejection filters, analyzer, spectrograph, and CCD or array detector. Low-frequency measurements may use volume Bragg gratings, multiple subtractive stages, or specialized interferometers.
Four calibrations are distinct:
- shift calibration: maps detector pixel to Raman shift using known laser and reference lines;
- resolution calibration: measures the instrument line shape and its dependence on slit, grating, wavelength, and pixel position;
- relative-intensity calibration: measures wavelength-dependent throughput from sample plane to detector;
- polarization calibration: measures preparation, leakage, and detection efficiency for each channel.
A silicon peak at the expected shift tests part of the first calibration. It does not establish intensity response, low-frequency rejection, or polarization purity. A calibrated luminescent standard can determine the wavelength-dependent instrument response, as explained by NIST. Match the standard to the excitation wavelength and measurement geometry. When converting spectra between wavelength and Raman shift, retain the spectral-density Jacobian as well as the photon-energy conversion; Choquette et al. describe these units for CCD measurements.
Spatial maps are sampled fields
Section titled “Spatial maps are sampled fields”Raman maps report a fitted quantity at each focus position. The optical point-spread function, sample topography, stage drift, finite integration time, and fit covariance determine the true spatial resolution. A map pixel can be smaller than the diffraction-limited spot without providing independent subspot information.
Store spectra, not only peak-fit maps. A peak-tracking algorithm can exchange labels at crossings, lock onto fluorescence ripples, or convert a two-phase mixture into one broadened peak. Inspect residuals and representative raw spectra from every inferred region.
Laser dose is part of the sample state
Section titled “Laser dose is part of the sample state”Report wavelength, power at the sample, spot estimate, dwell, repetitions, scan order, and atmosphere. Compare:
- increasing and decreasing power;
- first and repeated exposure at one point;
- fresh and previously illuminated positions;
- continuous and chopped illumination where possible;
- Raman thermometry with an independent structural or optical stability marker.
Photo-oxidation, desorption, defect creation, phase transformation, and charge trapping can be irreversible. A spectrum recorded after damage is reproducible only as a damaged-state measurement.
Data Reduction and Forward Modeling
Section titled “Data Reduction and Forward Modeling”A detector bin can be represented as
Here is a photon rate per unit angular-frequency shift into the collected angular range, is exposure time, is the dimensionless probability of assigning a photon to bin after resolution broadening, and is detection efficiency. All remaining terms are in counts: is fluorescence or broad luminescence, is dark and fixed-pattern response, represents sparse cosmic-ray events, and is counting and read noise. A normalized line-spread density must be integrated over the bin to obtain .
Baselines can remove physics
Section titled “Baselines can remove physics”Polynomial, spline, penalized, and morphology-based baselines encode different smoothness assumptions. A broad electronic continuum, two-magnon band, or quasielastic response can be smoother than the chosen baseline and disappear into it. Publish raw and corrected spectra, baseline parameters, excluded regions, and sensitivity to a reasonable family of backgrounds.
Fluorescence is not always a smooth polynomial. It can contain vibronic structure, detector etaloning, or laser-dependent decay. Changing excitation wavelength, time gating, or using anti-Stokes data can provide stronger discrimination than a higher-order fit.
Fit area, width, and covariance together
Section titled “Fit area, width, and covariance together”Peak height is highly correlated with width and background. For overlapping modes, fit all spectra in a temperature, polarization, or spatial series with shared physical constraints when justified, while allowing enough flexibility to expose model failure. Report integrated area, peak position, width convention, covariance, instrument convolution, and residuals.
Do not convert a fitted Lorentzian width to a lifetime when inhomogeneous strain, unresolved splitting, spectral diffusion, or instrumental broadening dominates. A narrow peak can be resolution limited, and a broad peak can be a mixture rather than a short-lived quasiparticle.
Interpreting a new feature
Section titled “Interpreting a new feature”A newly resolved line first establishes an excitation in a particular measured channel. Its microscopic assignment becomes stronger when one model explains several independent changes: polarization rotation, isotope substitution, magnetic field, temperature, or laser energy. For example, splitting consistent with a lowered point group should also be tested against domains and strain; a broad magnetic band should be compared with the exchange scale and neutron spectrum.
Three distinctions prevent common misreadings. A weak crossed peak may be leakage or misalignment. A broad continuum can be removed inadvertently by a smooth baseline. A sharp superconducting feature need not equal twice the maximum gap, because the Raman vertex and final-state interactions select and reshape the response; see unconventional superconductivity. Keep these alternatives beside the relevant fit rather than assigning a microscopic label from the peak shape alone.
Exercises
Section titled “Exercises”1. Why first-order Raman is near the zone center
Section titled “1. Why first-order Raman is near the zone center”A backscattering experiment uses vacuum wavelength . Neglect refraction and estimate the maximum photon momentum transfer in . Compare it with a typical Brillouin-zone scale of .
Solution
In backscattering,
Since ,
This is about of a zone scale. Refraction can multiply it by an index of order unity, but the first-order process still probes close to . Two-particle and defect-assisted processes can sample larger internal momenta while conserving total momentum. Resonant enhancement alone does not supply the missing momentum.
2. Tetragonal polarization channels
Section titled “2. Tetragonal polarization channels”Using the symmetric tensors above, show that selects and selects , where and . Find the fraction of maximum intensity leaking into nominal if both polarization axes are misoriented by . Why is the symmetric-tensor qualification needed?
Solution
For geometry,
Only has a nonzero element, equal to . The and tensors are diagonal.
For crossed rotated axes,
Thus ideal isolates within this symmetric approximation. With misorientation , the crossed fraction is ; at it is , or . This is geometric mixing, even without imperfect polarizers. An antisymmetric tensor also has crossed matrix elements, so the general resonant case need not isolate either symmetric channel.
3. Bose population in a Stokes spectrum
Section titled “3. Bose population in a Stokes spectrum”A mode has Raman shift , corresponding to . Assuming its intrinsic and optical prefactor do not change, estimate the ratio of Stokes intensities at and .
Solution
The Stokes population factor is
At , , so
At , :
Therefore
Real phonon frequency, linewidth, Raman tensor, absorption, and sample temperature can all change, so this is only the population contribution.
4. Fleury–Loudon selection on a square lattice
Section titled “4. Fleury–Loudon selection on a square lattice”For a nearest-neighbor square-lattice Heisenberg model with equal bond length, evaluate the polarization weights in geometry. Show why the resulting operator has bond symmetry. Compare it with the fully symmetric sum of the and operators and explain why the latter has no inelastic response in this model.
Solution
Take
For an bond,
For a bond, the product is . Hence
The sign changes under a rotation, which is the bond pattern. The operator can create two-magnon weight even though the total photon momentum is small. By contrast, for this nearest-neighbor model. In an energy eigenbasis, , so it cannot connect states of different energy. Extra exchange paths or a different light-coupling operator can remove this cancellation.
5. A Fano zero and maximum
Section titled “5. A Fano zero and maximum”For the normalized Fano factor
take . Find the antiresonance zero and the finite stationary maximum.
Solution
The numerator vanishes at
Differentiating gives stationary points at and
At the latter,
The asymmetric maximum and zero arise from interference. Changing the sign convention for changes the reported sign of .
6. Screening a fully symmetric vertex
Section titled “6. Screening a fully symmetric vertex”Consider a circular two-dimensional Fermi surface and a real vertex . For this exercise suppose the relevant irreducible responses share a nonzero factor :
where is a uniform angular average. Apply the strong-screening limit. Does a fully symmetric vertex always disappear?
Solution
The angular averages are and . Therefore
Screening removes the constant part , not the angular variation. The response vanishes when in this limit. All terms transform as , so the symmetry label alone cannot decide the answer. This calculation assumes the stated common factor and strong-screening regime; it is not a replacement for a conserving finite-momentum response calculation in an arbitrary metal.
References
Section titled “References”- M. Balkanski, R. F. Wallis, and E. Haro, “Anharmonic Effects in Light Scattering Due to Optical Phonons in Silicon,” Physical Review B 28, 1928–1934 (1983), doi:10.1103/PhysRevB.28.1928.
- S. J. Choquette, E. S. Etz, W. S. Hurst, D. H. Blackburn, and S. D. Leigh, “Relative Intensity Correction of Raman Spectrometers: NIST SRMs 2241 Through 2243 for 785 nm, 532 nm, and 488 nm/514.5 nm Excitation,” Applied Spectroscopy 61, 117–129 (2007), NIST full text.
- T. P. Devereaux and R. Hackl, “Inelastic Light Scattering from Correlated Electrons,” Reviews of Modern Physics 79, 175–233 (2007), doi:10.1103/RevModPhys.79.175.
- U. Fano, “Effects of Configuration Interaction on Intensities and Phase Shifts,” Physical Review 124, 1866–1878 (1961), doi:10.1103/PhysRev.124.1866.
- A. C. Ferrari and D. M. Basko, “Raman Spectroscopy as a Versatile Tool for Studying the Properties of Graphene,” Nature Nanotechnology 8, 235–246 (2013), doi:10.1038/nnano.2013.46.
- P. A. Fleury and R. Loudon, “Scattering of Light by One- and Two-Magnon Excitations,” Physical Review 166, 514–530 (1968), doi:10.1103/PhysRev.166.514.
- C. Kranert, C. Sturm, R. Schmidt-Grund, and M. Grundmann, “Raman Tensor Formalism for Optically Anisotropic Crystals,” Physical Review Letters 116, 127401 (2016), doi:10.1103/PhysRevLett.116.127401.
- C. Lee et al., “Anomalous Lattice Vibrations of Single- and Few-Layer MoS,” ACS Nano 4, 2695–2700 (2010), doi:10.1021/nn1003937.
- K. F. Mak, C. Lee, J. Hone, J. Shan, and T. F. Heinz, “Atomically Thin MoS: A New Direct-Gap Semiconductor,” Physical Review Letters 105, 136805 (2010), doi:10.1103/PhysRevLett.105.136805.
- National Institute of Standards and Technology, “Relative Intensity Correction Standards for Fluorescence and Raman Spectroscopy”, including SRM 2241–2243 and related certificates.
- D. L. Rousseau, R. P. Bauman, and S. P. S. Porto, “Normal Mode Determination in Crystals,” Journal of Raman Spectroscopy 10, 253–290 (1981), doi:10.1002/jrs.1250100152.
- B. S. Shastry and B. I. Shraiman, “Theory of Raman Scattering in Mott–Hubbard Systems,” Physical Review Letters 65, 1068–1071 (1990), doi:10.1103/PhysRevLett.65.1068.
- D. Yoon et al., “Interference Effect on Raman Spectrum of Graphene on SiO/Si,” Physical Review B 80, 125422 (2009), doi:10.1103/PhysRevB.80.125422.