

Vibrations of Diatomics
A diatomic vibration is quantum motion in the internuclear separation , not a pair of nuclei following a sharply defined classical trajectory. On an isolated electronic potential, the lowest vibrational states usually sample a narrow neighborhood of an equilibrium separation . The local curvature then produces an oscillator scale. Real molecular wells are asymmetric and dissociate, however, so their level spacings usually decrease with excitation and their spectra carry information beyond a single force constant.
Required background. Born–Oppenheimer separation and potential-energy surfaces define the nuclear potential. The harmonic oscillator supplies its local spectrum and matrix elements.
From a Molecular Hamiltonian to One Coordinate
Section titled “From a Molecular Hamiltonian to One Coordinate”Assumptions behind the radial problem
Section titled “Assumptions behind the radial problem”Consider two nuclei and on one isolated adiabatic electronic surface. Remove overall center-of-mass translation and define
with nuclear reduced mass
For a closed-shell electronic state, after neglecting electronic angular momentum, spin couplings, and nonadiabatic channel mixing, the reduced radial equation is
The reduced wavefunction obeys
Here may be a Born–Oppenheimer potential alone or a declared effective curve containing diagonal adiabatic corrections. The distinction matters at high accuracy. Born–Oppenheimer in Molecules derives this hierarchy and its corrections.
This page first sets to isolate vibration:
Rotation is not absent from real gas-phase infrared spectra. It is temporarily projected out so that the vibrational structure can be identified cleanly. Rotations of Molecules develops the rotational terms.
Energy-zero and dissociation conventions
Section titled “Energy-zero and dissociation conventions”Choose the potential minimum as zero:
For a bound electronic state that correlates with a separated-fragment channel,
is the well depth measured from the equilibrium minimum. The dissociation energy from the lowest vibrational state is instead
Within a single uncoupled vibrational curve,
When energies are divided by , use tildes:
Confusing with discards the vibrational zero-point energy. Confusing either with a thermochemical bond energy can also hide electronic degeneracies, fine structure, thermal averaging, and the identity of the dissociation products.
Harmonic Approximation Near Equilibrium
Section titled “Harmonic Approximation Near Equilibrium”Curvature defines the leading model
Section titled “Curvature defines the leading model”Let
For a smooth potential near a stable minimum,
where
Retaining only the quadratic term gives
The molecular coordinate has the exact domain . The harmonic model extends it to the full real line. That extension is accurate only when the relevant wavefunction is exponentially small near and well localized far from dissociation.
Frequency notation without ambiguity
Section titled “Frequency notation without ambiguity”Molecular spectroscopy and oscillator mechanics use similar symbols for different quantities. This page reserves for angular frequency:
The corresponding ordinary frequency and harmonic wavenumber are
In conventional diatomic spectroscopy, the wavenumber is normally written . Thus
has units of when and the length unit are chosen consistently. It is not an angular frequency despite the symbol.
| Symbol on this page | Meaning | Typical unit |
|---|---|---|
| angular frequency | ||
| ordinary frequency | ||
| conventional spectroscopic harmonic constant | ||
| vibrational term value relative to a stated zero |
The conversion back to a force constant is
Using an observed fundamental band position in this equation silently treats an anharmonic transition interval as the harmonic constant. That substitution is often numerically close for low levels but is conceptually wrong.
Harmonic levels and wavefunction scale
Section titled “Harmonic levels and wavefunction scale”Borrowing the canonical oscillator solution,
In term-value units,
The natural oscillator length is
For level ,
The ground-state root-mean-square displacement is therefore
This width is a probability-distribution scale. It is not the amplitude of a nucleus executing a classical orbit. In an anharmonic well, generally becomes positive because the wavefunction samples farther toward the softer dissociation side.
A local validity test
Section titled “A local validity test”At a characteristic displacement , compare higher terms with the quadratic energy:
For the ground state, is a useful first estimate. For excited states, the sampled width grows approximately as , so a harmonic approximation that is excellent at can fail badly at larger .
Curvature alone determines only the local oscillator scale. It does not determine the global well depth, the number of bound states, or the dissociation products.
Reduced Mass and Isotope Scaling
Section titled “Reduced Mass and Isotope Scaling”What isotopic substitution changes
Section titled “What isotopic substitution changes”In the strict Born–Oppenheimer approximation, isotopologues share the same electronic potential but have different nuclear masses. Holding the curvature fixed gives
The zero-point energy and ground-state width scale as
Thus a heavier isotopologue has:
- a smaller vibrational spacing;
- a smaller zero-point energy;
- a narrower low-lying vibrational distribution;
- usually a larger for the same , because less energy is already stored in zero-point motion.
These statements are leading mass laws. At spectroscopic precision, diagonal adiabatic corrections, nonadiabatic effective masses, nuclear size, and hyperfine structure produce deviations.
A hydrogen-chloride estimate
Section titled “A hydrogen-chloride estimate”For a rough isotope estimate, use atomic masses
gives approximately
The common-surface harmonic prediction is
Atomic masses approximate part of the electronic inertia; they are not the nuclear masses in the strict leading Hamiltonian. At high accuracy, mass conventions and explicit recoil corrections must be consistent. This ratio is a model prediction, not an exact isotope identity. Comparing several constants and isotopologues is one way to expose corrections beyond the leading Born–Oppenheimer picture.
Dunham organization
Section titled “Dunham organization”A widely used effective expansion combines vibration and rotation:
For pure vibration,
where denotes the product . In the leading Born–Oppenheimer mass scaling,
Examples are
The expansion is an effective representation over a fitted range. Its coefficients can include perturbations, and a finite polynomial in should not be extrapolated casually to dissociation.
Anharmonic Vibrational Structure
Section titled “Anharmonic Vibrational Structure”Why real intervals contract
Section titled “Why real intervals contract”A molecular bond is steep under compression and soft toward dissociation. The cubic term represents the leading local asymmetry; quartic and higher terms further change the level pattern. The resulting eigenstates are not exact harmonic number states, and adjacent spacings are no longer equal.
Spectroscopists organize the vibrational term values as
The products and are each reported in wavenumber units. For the common case , the quadratic correction lowers high levels and makes the ladder contract.
Keeping two terms,
Therefore
The first line is the fundamental, the second is a hot-band interval, and the third is the first overtone interval. An overtone position is not twice the observed fundamental once anharmonicity is present.
Zero-point energy
Section titled “Zero-point energy”The term-value expansion gives
Consequently,
within the declared one-surface model. A measured spectrum gives level differences most directly; obtaining and the dissociation limit requires a model, additional bands, or independent threshold information.
An evaluated HCl progression
Section titled “An evaluated HCl progression”The 2004 NIST–JANAF evaluation tabulates the following ground-state term differences for its effective-isotope thermochemical representation of HCl, constructed from spectroscopic data. These are useful for seeing the contraction, but are not an isotope-resolved line list for :
| () | Adjacent spacing () | |
|---|---|---|
| 0 | 0.00 | — |
| 1 | 2885.36 | 2885.36 |
| 2 | 5666.79 | 2781.43 |
| 3 | 8345.05 | 2678.26 |
| 4 | 10920.63 | 2575.58 |
| 5 | 13393.64 | 2473.01 |
The nearly decrease per step at low is the operational signature of leading anharmonicity. The progression is not exactly linear, so higher-order terms and a global potential are needed for precision or near-dissociation work.
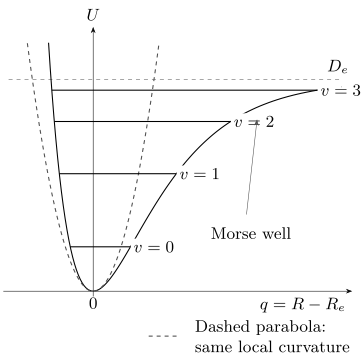
The harmonic parabola matches only the local curvature at and has an infinite equally spaced ladder. The plotted Morse model has an asymmetric well and a finite, contracting ladder. Solid horizontal lines end at its classical turning points; the dashed parabola has the same curvature at the minimum. This model illustrates the trend without fitting a particular molecule.
The Morse Potential
Section titled “The Morse Potential”Definition and local curvature
Section titled “Definition and local curvature”The Morse model replaces the global parabola by
It has
and becomes strongly repulsive under compression. Its equilibrium curvature is
so the local angular frequency is
The three parameters , , and therefore encode the minimum position, well depth, and local stiffness.
Exact full-line Morse spectrum
Section titled “Exact full-line Morse spectrum”The familiar analytic solution extends to . It is not exactly the radial half-line problem with . For a molecular well far from , the artificial left tail is negligible for the levels of interest, making the full-line model useful.
Define
The bound-state energies relative to the minimum are
Equivalently,
Normalizable bound states satisfy
Unlike the harmonic oscillator, the Morse potential supports a finite number of vibrational levels. The spacing decreases toward the formal continuous endpoint, but there is no infinite accumulation of levels at threshold: only the finitely many integers satisfying the strict inequality are bound.
In spectroscopic units, the exact Morse spectrum has the two-term form
with the special Morse relation
Thus
This inversion is exact only if the entire potential is Morse. For a real molecule, and are low-energy local data; they do not generally determine the true asymptote.
What the model gets right
Section titled “What the model gets right”The Morse model improves on a global parabola by providing:
- an asymmetric well;
- decreasing level spacings;
- a finite dissociation energy;
- a finite bound-state ladder;
- analytic eigenvalues and wavefunctions;
- a transparent connection among curvature, anharmonicity, and depth.
It is therefore an excellent reasoning model and a useful basis for approximate calculations.
What the model gets wrong
Section titled “What the model gets wrong”For nondegenerate neutral atomic fragments without permanent multipoles, the nonretarded long-range attraction has an inverse-power form such as
Other asymptotic channels can have different leading powers, for example a resonant interaction or an ionic term. The Morse tail instead approaches its asymptote exponentially. Real potentials can also contain avoided crossings, multiple electronic channels, relativistic asymptotes, and short-range structure that three parameters cannot reproduce.
Consequences include:
- low-lying constants may fit well while is badly biased;
- the predicted number and placement of near-threshold states can be wrong;
- an exact Morse relation among constants is not a universal molecular identity;
- a fitted Morse curve should not be assigned uncertainty outside its calibration window without independent validation.
HCl as an extrapolation stress test
Section titled “HCl as an extrapolation stress test”The NIST Chemistry WebBook compilation gives for the ground state of
Treating those two local constants as an exact Morse spectrum predicts
Using the corresponding two-term zero-point value gives
The NIST-JANAF evaluation instead gives approximately
and its fitted potential predicts as the last bound vibrational level; this was an extrapolated level, not its highest directly observed one. The two-constant Morse extrapolation would allow levels through . The discrepancy is not a failure of the measured low-energy constants. It is a failure of an overly rigid global model.
Vibrational Selection Rules
Section titled “Vibrational Selection Rules”The transition moment is the central object
Section titled “The transition moment is the central object”In the electric-dipole approximation, light couples through
After projecting onto one electronic state and separating rotational factors, the vibrational transition moment contains
where is the relevant body-fixed electric-dipole function. A nonzero energy difference is not enough; absorption requires a nonzero matrix element for the actual interaction operator.
Expand the dipole function near equilibrium:
The constant term contributes
so a permanent dipole by itself cannot connect two orthogonal vibrational levels.
Harmonic fundamental rule
Section titled “Harmonic fundamental rule”Write
Then
and the linear dipole term gives
For absorption from a low-temperature sample, the dominant harmonic transition is usually
Its leading vibrational amplitude is
The mode is electric-dipole infrared active in this approximation only if
The relevant condition is a changing dipole moment, not merely a nonzero equilibrium dipole.
Overtones and hot bands
Section titled “Overtones and hot bands”The quadratic dipole term has
for in the harmonic basis. It can therefore drive a first overtone even when the potential remains harmonic. Conversely, an anharmonic potential mixes harmonic number states, allowing the linear dipole term to acquire matrix elements beyond .
Real overtone intensity can arise from both:
- electrical anharmonicity: nonlinear dependence of on ;
- mechanical anharmonicity: nonquadratic and the resulting mixed wavefunctions.
A hot band originates from a thermally populated excited vibrational level, such as . Its presence depends on temperature and population as well as on the transition moment.
The word forbidden should always be qualified. A vanishing leading electric-dipole matrix element does not exclude electric-quadrupole, magnetic-dipole, Raman, collision-induced, multiphoton, or symmetry-breaking processes.
Homonuclear and heteronuclear diatomics
Section titled “Homonuclear and heteronuclear diatomics”For an isolated homonuclear diatomic in a nondegenerate electronic state, inversion and nuclear-exchange symmetry force the permanent electric-dipole function to vanish:
Pure vibrational electric-dipole transitions are therefore absent at this level. The molecule still vibrates and has quantized vibrational levels; weaker quadrupole absorption and Raman scattering can probe them.
A heteronuclear molecule is not automatically strongly infrared active. Its intensity depends on derivatives of and on the vibrational overlap. It is possible in principle to have but , or but an anomalously small .
Selection Rules and Transition Rates develops the general symmetry logic behind matrix-element zeros. Molecular Physics explains how molecular symmetry classifies vibrational and transition operators.
Infrared Spectroscopy Connection
Section titled “Infrared Spectroscopy Connection”A gas-phase band is rovibrational
Section titled “A gas-phase band is rovibrational”For a transition from to ,
Writing separate effective terms,
The first bracket defines the vibrational band origin. The second produces rotational structure and depends on the vibrational state because the bond-length distribution changes with .
For a simple linear electric-dipole band,
The lines form the branch and the lines form the branch. There is no branch in this simplest case, so the band origin may be inferred rather than represented by an observed line exactly at its position.
This is only the first branch picture. Rotation–vibration interaction, centrifugal distortion, electronic angular momentum, spin, parity, hyperfine structure, and perturbations by nearby states require a coupled effective Hamiltonian.
Rovibrational Coupling develops state-dependent rotational constants, P/Q/R branches, combination differences, branch heads, line strengths, and coupled-state diagnostics without duplicating the radial vibrational derivation here.
What line positions reveal
Section titled “What line positions reveal”With a controlled assignment, infrared frequencies can constrain:
- the fundamental and hot-band term differences;
- anharmonic constants from interval contraction;
- isotope shifts and leading mass scaling;
- state-dependent rotational constants and vibrationally averaged bond lengths;
- perturbations caused by nearby vibrational or electronic states;
- high-lying level convergence toward dissociation when enough of the progression is observed.
Frequencies determine differences, not absolute energies. Combination differences exploit this:
Shared lower or upper terms cancel, allowing assignments and level spacings to be checked with less dependence on an assumed global Hamiltonian.
What intensities reveal
Section titled “What intensities reveal”After separating rotational, polarization, and statistical factors, a line strength contains
An observed absorption signal also depends on:
- lower-state population and degeneracy;
- stimulated emission from the upper state;
- temperature and nuclear-spin statistical weights;
- path length and number density;
- polarization and rotational line-strength factors;
- Doppler, pressure, natural, transit-time, and instrumental broadening;
- unresolved isotopologues and overlapping bands.
Therefore a strong line is not simply the transition with the largest dipole derivative, and a missing line is not automatically a strict symmetry zero.
Vibrational spectroscopy explains how calibrated intensities and assigned frequencies are compared with these models. Low- data constrain local curvature and anharmonicity much more directly than they constrain the dissociation limit.
Worked Example: Curvature and Zero-Point Width of HCl
Section titled “Worked Example: Curvature and Zero-Point Width of HCl”Take the tabulated harmonic constant
for and
The angular frequency is
Hence
The harmonic ground-state root-mean-square displacement is
This calculation translates a spectroscopic curvature into a nuclear probability scale. It does not say that the bond length oscillates classically between , and it does not include anharmonic skewness.
Exercises
Section titled “Exercises”1. Can the radial boundary be ignored?
Section titled “1. Can the radial boundary be ignored?”In the harmonic ground state, has variance . If , express the probability that the full-line oscillator assigns to the unphysical region .
Solution
The probability density is , so
The large-argument estimate gives . This supports extending the domain for this localized state, not for arbitrary high-lying states or a different potential.
2. Isotope shift and zero-point width
Section titled “2. Isotope shift and zero-point width”Two isotopologues share the same potential curvature, and their reduced masses satisfy
Find the ratios of harmonic wavenumbers, zero-point energies, and ground-state root-mean-square widths.
Solution
The harmonic wavenumber and zero-point energy scale as :
The width scales as :
Heavier isotopes reduce the energy scale more strongly than they narrow the coordinate distribution.
3. Infer two effective constants
Section titled “3. Infer two effective constants”Suppose the first two adjacent vibrational intervals are
and
Using only the two-term expression, estimate and .
Solution
The two equations are
Subtracting gives
so
Then
These are effective two-constant values inferred from two intervals. They differ slightly from a broader high-precision fit because cubic and higher term coefficients are not actually zero.
4. Fundamental versus overtone
Section titled “4. Fundamental versus overtone”For
find the two-term positions of the fundamental , the hot band , and the first overtone .
Solution
The fundamental is
The hot band is
The overtone is
Twice the fundamental is , not . Anharmonicity makes the overtone less than twice the fundamental.
5. Morse bound-state count
Section titled “5. Morse bound-state count”A Morse model has
Which vibrational quantum numbers are bound?
Solution
The normalizability condition is
Thus
The allowed nonnegative integers are
There are six bound vibrational states. A state at the exact threshold would not be a normalizable bound state.
6. Electrical anharmonicity
Section titled “6. Electrical anharmonicity”Let
while the vibrational states remain harmonic. Find the leading amplitudes for and in terms of
Solution
Since
the fundamental matrix element is
Therefore
For the overtone,
The quadratic dipole term gives
The overtone can therefore appear through a nonlinear dipole function even with harmonic vibrational wavefunctions.
References
Section titled “References”- P. F. Bernath, Spectra of Atoms and Molecules, 4th ed., Oxford University Press, 2020.
- J. M. Brown and A. Carrington, Rotational Spectroscopy of Diatomic Molecules, Cambridge University Press, 2003.
- P. R. Bunker and P. Jensen, Molecular Symmetry and Spectroscopy, 2nd ed., NRC Research Press, 1998.
- J. L. Dunham, “The Energy Levels of a Rotating Vibrator,” Physical Review 41, 721–731 (1932), doi:10.1103/PhysRev.41.721.
- G. Herzberg, Molecular Spectra and Molecular Structure. I. Spectra of Diatomic Molecules, 2nd ed., Van Nostrand, 1950.
- IUPAC, “transition moment”, Compendium of Chemical Terminology, 5th ed., 2025, doi:10.1351/goldbook.T06460.
- IUPAC, “vibrational term value”, Compendium of Chemical Terminology, 5th ed., 2025, doi:10.1351/goldbook.08709.
- P. M. Morse, “Diatomic Molecules According to the Wave Mechanics. II. Vibrational Levels,” Physical Review 34, 57–64 (1929), doi:10.1103/PhysRev.34.57.
- NIST Chemistry WebBook, SRD 69, Hydrogen chloride: constants of diatomic molecules, data compilation by K. P. Huber and G. Herzberg.
- D. H. Rank, D. P. Eastman, B. S. Rao, and T. A. Wiggins, “Rotational and Vibrational Constants of the and Molecules,” Journal of the Optical Society of America 52, 1–7 (1962), doi:10.1364/JOSA.52.000001.
- D. H. Rank, B. S. Rao, and T. A. Wiggins, “Molecular Constants of ,” Journal of Molecular Spectroscopy 17, 122–130 (1965), doi:10.1016/0022-2852(65)90114-1.
- E. A. Shenyavskaya and V. S. Yungman, “NIST-JANAF Thermochemical Tables. III. Diatomic Hydrogen Halide Gases,” Journal of Physical and Chemical Reference Data 33, 923–957 (2004), doi:10.1063/1.1638781.
- Y. P. Varshni, “Comparative Study of Potential Energy Functions for Diatomic Molecules,” Reviews of Modern Physics 29, 664–682 (1957), doi:10.1103/RevModPhys.29.664.
- E. B. Wilson Jr., J. C. Decius, and P. C. Cross, Molecular Vibrations, McGraw–Hill, 1955; Dover reprint, 1980.