

Optical Lattices
An optical lattice is a periodic center-of-mass potential for neutral atoms or molecules, produced by the spatially varying AC Stark shift of interfering laser fields. The light supplies the periodic structure; the particles remain quantum mechanical matter waves whose Bloch bands, tunneling amplitudes, interactions, and heating rates must be calculated and measured.
Required background. Optical dipole traps and AC Stark shifts connect electric fields to potentials. Ultracold atoms supplies collision and degeneracy scales; Bloch’s theorem explains quasimomentum. Here these ingredients lead to bands, loading protocols, and measurable hopping and interaction parameters.
The sinusoidal lattice and recoil convention
Section titled “The sinusoidal lattice and recoil convention”For the basic one-dimensional lattice, take two monochromatic plane waves with common angular frequency , vacuum wavelength , and wave-number magnitude
Unless stated otherwise:
- the beams counterpropagate along the axis;
- their optical polarizations are parallel and their frequencies are equal;
- denotes the modulation depth between a minimum and an adjacent maximum;
- a convenient origin gives ;
- the lattice period is ;
- quasimomentum has momentum units and lies in the first Brillouin zone ;
- is the single-photon recoil energy;
- is the dimensionless lattice depth.
Other conventions are common. Some authors use a wave-vector quasimomentum , put the Brillouin-zone edge at , or write . The sine and cosine forms differ only by a translation when is a scalar potential. A quoted “lattice depth of 8” is incomplete unless the energy unit, usually , is stated.
From Interfering Fields to a Periodic Potential
Section titled “From Interfering Fields to a Periodic Potential”Counterpropagating fields
Section titled “Counterpropagating fields”Write two equal-amplitude real electric fields as
Their sum can be written
Define the equivalent electric intensity by . This measures the electric field that produces the light shift, not the net Poynting flux, which vanishes in an ideal equal-beam standing wave. Then
The maxima repeat when advances by , so
The relative optical phase translates the lattice. With the intensity form above, a small phase shift gives
Phase noise is therefore position noise, and a deliberate phase ramp is a way to move or shake the lattice.
Light shift and sign
Section titled “Light shift and sign”For an internal state whose center-of-mass motion can be described by a scalar dynamic polarizability,
Here , so is a peak complex amplitude and the coefficient is exactly within the weak-field polarizability approximation. Assume one adiabatically followed internal state, negligible dissipative response, and negligible motional geometric corrections. Dropping a spatially constant energy offset and choosing an origin gives
Positive gives attraction to intensity maxima; negative gives attraction to minima. These are usually called red- and blue-detuned lattices relative to a dominant transition; in a multilevel atom the sign follows the full polarizability. Both cases can be represented by the positive-depth sine-squared form after shifting the coordinate and the energy zero.
That translation equivalence does not make red and blue lattices experimentally identical. Particles near a blue-detuned minimum can sample less light and therefore scatter fewer photons, while polarization gradients, vector and tensor shifts, and imperfections can differ between the two implementations.
Unequal beam intensities
Section titled “Unequal beam intensities”If the two intensities are and , the interference term has contrast
The total intensity is
The electric-intensity difference between maxima and minima is ; multiply it by the appropriate light-shift coefficient to obtain . The residual intensity at a minimum is . An unequal-beam blue lattice therefore has no perfectly dark minimum. The spatial average is a Fourier constant, not a separate uniform photon-scattering source: the local scattering rate depends on the full interfering field, including its nodes. Inferring from total power while assuming unit contrast can therefore overestimate the lattice depth.
Beams crossing at an angle
Section titled “Beams crossing at an angle”Let the two wave vectors enclose an angle . The interference wave vector is
The fringe spacing normal to the planes is
Counterpropagation gives the smallest spacing, . A small angular error changes both the spacing and the recoil scale associated with the interference pattern.
Moving lattices
Section titled “Moving lattices”If the two fields differ in angular frequency by , the interference phase contains
For counterpropagating beams, the lattice velocity is
Frequency offsets therefore create controlled transport, inertial forces, and Bragg couplings. An unintended offset makes the potential time dependent in the laboratory frame.
Lattice Geometry
Section titled “Lattice Geometry”One, two, and three dimensions
Section titled “One, two, and three dimensions”An ideal plane standing wave confines periodically along one direction and is uniform transversely. Real beam envelopes can also confine the transverse motion. Orthogonal standing waves can form a separable lattice when unwanted cross-interference terms vanish by polarization or average away through suitable frequency offsets,
One deep axis can divide a cloud into two-dimensional layers; two deep axes can make one-dimensional tubes; three comparable axes can make a cubic lattice. The resulting kinematics are low dimensional only if transverse excitation and interaction-induced mode mixing are negligible on the scales being studied.
Nonseparable and multibeam lattices
Section titled “Nonseparable and multibeam lattices”Several beams with nonorthogonal wave vectors can create triangular, honeycomb, kagome, superlattice, or other unit cells. In such cases one must calculate the full intensity and polarization pattern before naming the lattice. Pairwise interference terms can introduce unintended periodicities, and polarization-dependent light shifts can make different internal states see different unit cells.
A primitive lattice is specified by real-space vectors . Reciprocal vectors obey
The geometry fixes the Brillouin zone and coordination network. It does not fix the hopping matrix: orbital symmetry, depth, sublattice offsets, and laser-assisted couplings also matter.
Gaussian envelopes
Section titled “Gaussian envelopes”Real lattice beams have finite waists. A nominally one-dimensional standing wave may be modeled locally as
where is transverse to the beam. The envelope causes:
- a position-dependent lattice depth and band structure;
- additional smooth confinement or antitrapping;
- spatially varying tunneling and onsite interaction;
- imperfect translational symmetry;
- sensitivity to beam pointing and waist calibration.
Compensating beams or a flat-bottom trap can reduce inhomogeneity, but their residual potentials must still enter the model.
Recoil Units and Reciprocal Momentum
Section titled “Recoil Units and Reciprocal Momentum”For the counterpropagating lattice,
The periodic potential contains Fourier components at . It therefore couples plane-wave momentum states that differ by
The conventional recoil energy nevertheless uses the one-photon momentum :
This convention is useful because the free-particle states that become degenerate at the first Brillouin-zone edge have momenta and kinetic energy .
Useful dimensionless quantities include
At fixed wavelength, heavier particles have smaller . The same optical depth in hertz can therefore represent a different value of for another isotope or molecule.
The Single-Particle Band Problem
Section titled “The Single-Particle Band Problem”Dimensionless Schrödinger equation
Section titled “Dimensionless Schrödinger equation”For one dimension,
Using and dividing by gives
This is a Mathieu-type eigenvalue problem. Once energy is measured in , its band structure depends only on for the ideal one-dimensional sinusoidal lattice.
Bloch theorem gives
with
The band index records distinct eigenvalues at the same quasimomentum. Quasimomentum is conserved by a perfectly translation-invariant static lattice, but ordinary mechanical momentum is not.
Plane-wave matrix
Section titled “Plane-wave matrix”A direct numerical route expands
Because
the dimensionless matrix is tridiagonal:
Convergence is checked by increasing the plane-wave cutoff. This small matrix calculation is often more reliable than applying a deep-lattice asymptotic formula at a moderate value of .
Weak-lattice gap
Section titled “Weak-lattice gap”At , the free states with momenta and are degenerate at the Brillouin-zone edge. The Fourier component couples them. Degenerate perturbation theory gives the matrix
so the leading band gap is
The gap is not because is a real-space peak-to-trough depth, whereas the avoided crossing is set by a Fourier matrix element.
Deep-lattice onsite motion
Section titled “Deep-lattice onsite motion”Near a minimum,
Matching to gives
or
This scale approximates the separation of low onsite vibrational levels, not the exact gap everywhere in the Brillouin zone. Anharmonicity lowers the spacing for higher local levels, and tunneling broadens each onsite level into a band.
The harmonic-oscillator length is
It shrinks only as even though tunneling falls much more rapidly.
Wannier Orbitals and Tight Binding
Section titled “Wannier Orbitals and Tight Binding”For an isolated band, a localized Wannier orbital may be constructed from Bloch states:
The phase choice of affects the shape and center of the Wannier function, though not the band energies. For the real scalar sinusoidal potential used here, an isolated one-dimensional band admits well-localized real Wannier orbitals. Composite or topological bands require more care.
For distinct sites , projecting the one-particle Hamiltonian into these orbitals gives hopping matrix elements
If only nearest neighbors matter,
The lowest-band width is then
Near the band minimum,
with
A measured width or curvature can therefore determine only after the assumed hopping range has been tested. If next-nearest-neighbor hopping is appreciable, one number does not determine the full dispersion.
Deep-lattice tunneling estimate
Section titled “Deep-lattice tunneling estimate”For , the lowest-band nearest-neighbor hopping has the asymptotic form
Its exponential dependence is physically important: moderate depth changes can alter dynamical time scales by orders of magnitude. The formula is not an exact calibration curve. At experimentally common moderate depths, diagonalizing the actual periodic potential can shift by tens of percent.
Projecting a continuum gas into lattice orbitals
Section titled “Projecting a continuum gas into lattice orbitals”For one internal component of a dilute Bose gas, begin from
For weak three-dimensional scattering, the leading projected contact coupling is
If the lowest band is isolated and interaction-induced orbital deformation is small, expand
The leading parameter dictionary is
These expressions assume weak orbital deformation, a slowly varying external potential whose off-diagonal matrix elements are negligible, and a consistently regularized low-energy interaction. Near an onsite resonance, the Born-like overlap formula for must be replaced by few-body matching. A common band-center offset may be absorbed in the chemical potential.
For bosons, the onsite interaction contributes . For a two-component Fermi gas, the leading -wave term is . The canonical model pages derive the corresponding Hamiltonians and conventions.
What the optical knobs really control
Section titled “What the optical knobs really control”The controls are correlated:
| Experimental control | Leading effect | Coupled consequences |
|---|---|---|
| lattice intensity | increases | narrows bands, localizes Wannier orbitals, changes and |
| wavelength and angle | set and | change band scale, density per site, and optical response |
| scattering length | changes contact coupling | changes , loss, molecular physics, and multiband mixing |
| beam phase | translates or shakes the lattice | can heat, drive tunneling, or create inertial forces |
| polarization | changes state-dependent light shifts | may create spin dependence and Raman scattering |
| Gaussian envelope | adds smooth confinement | changes filling and local energy offsets |
| modulation frequency | drives selected transitions | can also produce Floquet bands and heating |
Changing the lattice depth does not tune only . It also changes Wannier localization, , the band gap, density-dependent corrections, and sensitivity to noise.
Terms beyond the minimal model
Section titled “Terms beyond the minimal model”A microscopic projection can generate:
- longer-range and anisotropic hopping;
- density-assisted tunneling;
- pair hopping;
- offsite interactions;
- state-dependent site energies;
- multiple orbitals per site;
- confinement-induced modifications of scattering;
- virtual-band corrections and effective multibody interactions;
- loss terms and time-dependent couplings.
The smallest Hamiltonian is justified by a numerical or experimental error budget, not by the visual regularity of the array.
Loading the Lattice
Section titled “Loading the Lattice”Single-particle adiabaticity
Section titled “Single-particle adiabaticity”Suppose the depth is ramped as . In an ideal translation-invariant lattice, the ramp preserves quasimomentum and couples bands with the same . A local adiabatic criterion between instantaneous bands is
A ramp slow compared with is a useful first intuition, but the matrix element and the minimum gap along the ramp matter. Symmetry can suppress some couplings and imperfections can open others.
Many-body adiabaticity
Section titled “Many-body adiabaticity”Avoiding interband excitation does not guarantee that the many-body state remains near its ground state. The relevant energy or inverse-time scale can instead be:
- a finite-system many-body gap divided by ;
- a collective-mode frequency;
- a tunneling scale ;
- a superexchange scale ;
- a critical gap divided by that becomes small near a phase transition;
- an inverse redistribution time set by transport through the trap.
An experimentally reasonable ramp may therefore be adiabatic with respect to onsite vibrational motion and diabatic with respect to spin or mass transport. The final entropy distribution is part of the result.
Ramping back to the initial configuration can reveal irreversible heating, but recovery of one observable does not prove that the forward ramp followed the instantaneous many-body ground state.
Release and Momentum Diagnostics
Section titled “Release and Momentum Diagnostics”Sudden release
Section titled “Sudden release”If the lattice is turned off rapidly compared with band dynamics, the localized wave packets are projected onto free momentum states. For a single-band sample, the far-field distribution has the schematic form
The Wannier envelope and the one-body density matrix both matter. Interference peaks indicate coherence over multiple sites, but peak visibility alone is not a unique superfluid diagnostic: finite size, temperature, interactions during expansion, imaging resolution, and incoherent backgrounds affect it.
Band mapping
Section titled “Band mapping”In band mapping, the lattice is ramped down slowly enough to follow an instantaneous Bloch band into a free-particle momentum interval, but fast enough to suppress substantial redistribution from trapping, interactions, or collisions. Symbolically,
The first inequality aims to suppress interband transitions; the second aims to preserve the initial quasimomentum population. During ramp-down, free-particle degeneracies reappear and gaps close at zone boundaries. A finite ramp therefore cannot guarantee uniform band separation all the way to zero depth; boundary populations and finite momentum resolution need special care. There is no universal mapping time. It must be validated for the actual gap, interaction, confinement, and momentum resolution.
Band mapping estimates populations in Brillouin zones. It does not by itself reconstruct phase coherence, interaction energy, or the many-particle density matrix.
Calibrating the Optical Lattice
Section titled “Calibrating the Optical Lattice”No single method is reliable in every regime. A mature calibration uses at least one spectroscopic or dynamical method and checks it against the optical power, geometry, and polarizability model.
Optical forward model
Section titled “Optical forward model”The first estimate combines:
- power delivered to each beam at the atoms;
- beam waists and mode quality;
- interference contrast;
- polarization and magnetic-field orientation;
- species- and state-dependent dynamic polarizability;
- window losses and retroreflection efficiency.
This estimate is valuable for diagnosing drifts, but it is often limited by in-vacuum beam parameters. It should not be the only depth calibration.
Kapitza–Dirac diffraction
Section titled “Kapitza–Dirac diffraction”Apply the lattice for a short pulse to a narrow momentum distribution. In the Raman–Nath limit, kinetic evolution during the pulse is neglected. With
the nontrivial part of the pulse operator is
Using the Jacobi–Anger expansion gives diffraction orders with ideal populations
Fitting several pulse times or several diffraction orders can determine . The model fails when kinetic phases, interactions, initial momentum width, pulse-shape errors, or a spatially varying depth are important. The rough requirement becomes more restrictive when high diffraction orders are populated.
Modulation spectroscopy
Section titled “Modulation spectroscopy”Modulate the depth,
or, more transparently,
Excitation resonances constrain band gaps or many-body energy scales. For a symmetric well, depth modulation is even in displacement and position modulation is odd. In the harmonic limit, the ground state couples primarily to the second excited level under depth modulation (near ), and to the first under position modulation (near ). For Bloch states, inversion is a same-quasimomentum selection rule only at inversion-invariant momenta such as the zone center and edge; at generic , inversion relates to .
The observed maximum need not equal a bare band gap. Interactions, inhomogeneous broadening, finite pulse duration, nonlinear response, and population-dependent shifts can move or broaden it. Calibration should fit a forward model rather than assign a depth from one peak by eye.
Onsite vibrational spectroscopy
Section titled “Onsite vibrational spectroscopy”In a deep lattice, transitions between local vibrational levels probe and anharmonic corrections. The harmonic estimate
provides an initial inversion for , while a full band calculation improves the result. Parity and probe geometry determine which transitions are visible.
Tunneling dynamics
Section titled “Tunneling dynamics”Prepare an imbalance, a localized wave packet, or a tilted lattice and observe coherent transport. The oscillation or expansion dynamics can constrain and longer-range hopping directly. This is often closer to the parameter needed in a Hubbard model than a nominal optical depth is.
Interactions and dephasing must be included. A decay of oscillations does not uniquely measure tunneling; it can arise from trap inhomogeneity, collisions, technical noise, or averaging over different local depths.
Bloch oscillations
Section titled “Bloch oscillations”Under a uniform force ,
Advancing across a Brillouin zone of width gives the Bloch period
Bloch oscillations accurately connect force, spacing, and quasimomentum dynamics. Their amplitude and waveform can constrain the band dispersion, but the period alone does not determine .
Comparing calibration methods
Section titled “Comparing calibration methods”| Method | Primary quantity | Leading model risk |
|---|---|---|
| optical power and polarizability | nominal | unknown in-vacuum intensity or polarization |
| Kapitza–Dirac diffraction | pulse area | breakdown of Raman–Nath dynamics |
| band or vibrational spectroscopy | energy differences | interactions and inhomogeneous broadening |
| tunneling dynamics | and possibly longer-range hopping | dephasing and trap averaging |
| band mapping | band populations | incompatible ramp time scales |
| Bloch oscillations | and dispersion response | Landau–Zener loss and confinement |
Agreement among methods tests more than statistical precision. A systematic disagreement can reveal imperfect contrast, multiband occupation, an incorrect polarizability, or a nonseparable potential.
Worked example: rubidium at 1064 nm
Section titled “Worked example: rubidium at 1064 nm”Consider in a one-dimensional lattice with
Using gives
The harmonic onsite estimate is
A converged plane-wave diagonalization of the ideal sinusoidal potential gives, for the lowest band,
If nearest-neighbor hopping dominates,
so
By comparison, the deep-lattice asymptotic formula gives
about above the plane-wave result. The example is deliberately at a moderate depth: it shows why an asymptotic expression is a scale check, not a precision calibration.
For the same ideal calculation, the minimum gap from the lowest to the first excited band occurs at the zone edge and is approximately
or . This is comfortably larger than , but a drive, interaction energy, or ramp rate must be compared with the gap independently.
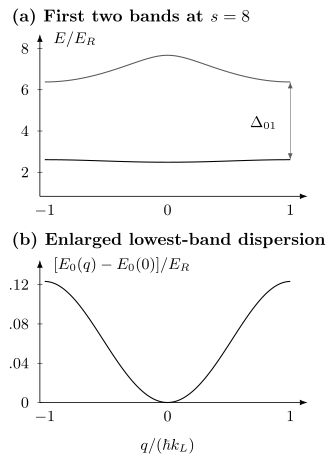
The plane-wave matrix above at gives (a) two isolated bands with minimum gap at the zone edge and (b) a much narrower lowest band, enlarged after subtracting . Its width is . The two panels use different vertical scales; the onsite harmonic spacing is not the minimum interband gap.
Heating and Coherence Limits
Section titled “Heating and Coherence Limits”Photon scattering
Section titled “Photon scattering”The same optical susceptibility that creates the conservative potential has an absorptive part. Off-resonant scattering can:
- add recoil energy;
- change hyperfine or Zeeman states through Raman processes;
- dephase superpositions;
- eject particles from shallow bands or traps;
- create density-dependent loss after state changes.
The scattering rate is species-, wavelength-, polarization-, and state-dependent. It cannot be inferred from alone. Optical Dipole Traps page explains the polarizability and fixed-depth detuning trade-off.
Intensity noise
Section titled “Intensity noise”Depth noise changes:
Noise near twice an onsite trap frequency can drive parametric heating. Low-frequency drift changes the Hamiltonian between shots. Because depends exponentially on in a deep lattice, a small depth fluctuation can become a much larger fractional tunneling fluctuation.
Phase and frequency noise
Section titled “Phase and frequency noise”Relative phase noise translates the lattice. It can excite dipole motion, drive interband transitions, or appear as an inertial force in the lattice frame. Relative frequency noise integrates into phase noise and can cause uncontrolled lattice velocity.
The relevant specification is the phase-noise spectrum at the atoms, including optical path motion after any common reference point. A narrow laser linewidth does not guarantee a stable retroreflected standing wave.
Beam geometry noise
Section titled “Beam geometry noise”Pointing, waist, focus, and angle drift alter both the periodic depth and the smooth envelope. In multidimensional lattices they can change anisotropy and relative sublattice registration. Diagnostics should therefore monitor more than total power.
Interaction-induced heating and loss
Section titled “Interaction-induced heating and loss”Strong interactions can mix higher orbitals, generate doublons with large loss rates, or make an otherwise slow ramp diabatic. Near a Feshbach resonance, the scattering length alone may not describe onsite few-body physics. Molecules, effective range, confinement-induced resonances, and three-body channels may enter.
Floquet heating
Section titled “Floquet heating”Periodic shaking or modulation can engineer complex hopping and effective gauge fields. The effective Floquet Hamiltonian is useful only within a frequency and time window. Resonant coupling to higher bands, micromotion, interaction-assisted absorption, and eventual heating must be reported alongside the engineered parameter.
When one band is sufficient
Section titled “When one band is sufficient”For a static sample, compare temperature, hopping, force-induced energy offsets, and occupation-dependent interaction energies with the relevant band gaps. A bosonic site with many atoms can deform even if alone is small: is a useful initial interaction scale. Also bound longer-range hopping, offsite interactions, and changes due to virtual higher bands. Small observed excited-band population does not exclude virtual corrections.
For a driven sample, include amplitudes, frequencies, multiphoton resonances, and observation time. A frequency below the first gap is useful but not sufficient; a high-frequency drive can sometimes admit an effective model when its resonant transitions are suppressed. The relevant comparison is the actual transition probability over the experiment.
The Bose–Hubbard model and fermionic Hubbard model derive the many-body consequences of a controlled projection. Site-resolved fluorescence, compressibility, spectra, and spin correlations test different predictions. Loss, parity-sensitive detection, and hopping during imaging must be included when comparing those predictions with measured occupations.
For applications beyond a static scalar lattice, see ultracold-atom quantum simulation. Optical clocks uses state-dependent lattice shifts for precision spectroscopy.
Exercises
Section titled “Exercises”1. Fringe spacing and phase translation
Section titled “1. Fringe spacing and phase translation”Two equal-frequency beams of wavelength cross at .
- Find the fringe spacing.
- If the relative optical phase increases by , how far does the pattern translate along the interference wave vector?
- Compare with counterpropagating beams at the same wavelength.
Solution
The interference-wave-vector magnitude is
Therefore
A phase change translates the pattern by
For ,
For counterpropagating beams, , so
The same phase change then translates the lattice by .
2. A bandwidth that misses longer-range hopping
Section titled “2. A bandwidth that misses longer-range hopping”For , take and . Find the width and effective mass. Can measuring only the width detect ?
Solution
The derivative with respect to is . Under the stated bound, extrema occur only at the zone center and edge, so : the even hopping harmonic cancels from their difference. The curvature gives
For , the mass is times the nearest-neighbor estimate, despite an unchanged width. Measuring curvature or intermediate momenta therefore supplies information missing from .
3. Onsite oscillator scale
Section titled “3. Onsite oscillator scale”Expand a lattice well near a minimum and show that
Find at .
Solution
Near ,
Equating this with gives
Since
one obtains
The oscillator length is
Because ,
At , , so
This is a harmonic estimate for the local orbital width, not an exact Wannier-function result.
4. Kapitza–Dirac populations
Section titled “4. Kapitza–Dirac populations”A short lattice pulse has
Using , , and , estimate the populations in the orders . Check the partial normalization and state where the remaining probability resides.
Solution
The ideal Raman–Nath populations are
Therefore
The included orders sum to
The remaining probability, about with the rounded Bessel values, lies in and in rounding error. The momenta are .
If the pulse is not short enough, the observed populations are not given by these Bessel squares because kinetic phases accumulate during the pulse.
5. Band width, tunneling, and effective mass
Section titled “5. Band width, tunneling, and effective mass”The lowest band of a one-dimensional lattice has measured width . Assume a nearest-neighbor cosine band and lattice spacing .
- Find .
- Find for rubidium-87 with .
- Name one observation that could falsify the nearest-neighbor assumption.
Solution
For
the width is . Hence
The effective mass is
Using and gives
Thus . The enhanced mass describes the curvature of the lattice band; the atomic inertial mass in free space remains .
Measuring the dispersion at several quasimomenta can falsify the pure cosine form. A significant harmonic would reveal next-nearest-neighbor hopping. Real-space dynamics sensitive to multiple hopping distances provide another test.
6. Reproduce the sinusoidal bands
Section titled “6. Reproduce the sinusoidal bands”Use the plane-wave matrix to reproduce the width and edge gap at . Increase the cutoff and distinguish a converged band width from an exactly nearest-neighbor hopping coefficient.
Solution
This Python program requires NumPy:
import numpy as np
def bands(q, s=8.0, cutoff=8):    ell = np.arange(-cutoff, cutoff + 1)    diagonal = (q + 2*ell)**2 + s/2    coupling = np.full(2*cutoff, -s/4)    matrix = (np.diag(diagonal) + np.diag(coupling, 1)              + np.diag(coupling, -1))    return np.linalg.eigvalsh(matrix)
for cutoff in (6, 8, 10):    center, edge = bands(0, cutoff=cutoff), bands(1, cutoff=cutoff)    print(cutoff, edge[0] - center[0], edge[1] - edge[0])
Here the argument q is and every eigenvalue is in . The results converge to and . Interpreting as still assumes negligible odd hopping harmonics beyond the nearest neighbor. To determine individual coefficients, Fourier analyze throughout the Brillouin zone rather than fitting only its endpoints.
7. Single-band decision
Section titled “7. Single-band decision”An experiment reports
It applies amplitude modulation with and observes for while the measured heating time is . Which facts support a single-band equilibrium model, and which require further investigation?
Solution
The static low-energy scales satisfy
with ratios
Small supports a one-band kinetic description. The temperature is also well below the gap. The interaction ratio is not tiny; interaction-induced orbital deformation and virtual-band corrections should be calculated rather than dismissed.
The modulation frequency has
It approaches the band gap, so the driven experiment may excite higher bands even if the undriven model is one band. The drive matrix element, band dispersion, pulse spectrum, and observed higher-band population need measurement.
The observation-time fraction of the heating time is
That is not automatically negligible. One should measure the actual energy or entropy increase over and compare it with the required accuracy.
Finally, none of these ratios establishes equilibrium. Loading adiabaticity, redistribution through the trap, filling, and detector calibration remain separate questions.
8. Energy added by a short diffraction pulse
Section titled “8. Energy added by a short diffraction pulse”For an initially zero-momentum plane wave, the Raman–Nath pulse multiplies the wavefunction by up to a global phase. Calculate the mean kinetic energy after the pulse by differentiating this wavefunction. Compare with summing the diffraction-order energies.
Solution
Over one lattice period the normalized probability density remains uniform. The derivative of the phase gives momentum , so
Equivalently, each order has energy and population . Equality requires . The mean momentum vanishes by symmetry although the kinetic energy grows. The impulse approximation neglects motion during the pulse, not kinetic energy after it.
References
Section titled “References”- W. S. Bakr, J. I. Gillen, A. Peng, S. Fölling, and M. Greiner, “A Quantum Gas Microscope for Detecting Single Atoms in a Hubbard-Regime Optical Lattice,” Nature 462, 74–77 (2009), doi:10.1038/nature08482.
- I. Bloch, J. Dalibard, and W. Zwerger, “Many-Body Physics with Ultracold Gases,” Reviews of Modern Physics 80, 885–964 (2008), doi:10.1103/RevModPhys.80.885.
- L. W. Cheuk, M. A. Nichols, M. Okan, T. Gersdorf, V. V. Ramasesh, W. S. Bakr, T. Lompe, and M. W. Zwierlein, “Quantum-Gas Microscope for Fermionic Atoms,” Physical Review Letters 114, 193001 (2015), doi:10.1103/PhysRevLett.114.193001.
- T. Esslinger, “Fermi–Hubbard Physics with Atoms in an Optical Lattice,” Annual Review of Condensed Matter Physics 1, 129–152 (2010), doi:10.1146/annurev-conmatphys-070909-104059.
- R. P. Feynman, “Simulating Physics with Computers,” International Journal of Theoretical Physics 21, 467–488 (1982), doi:10.1007/BF02650179.
- M. Greiner, O. Mandel, T. Esslinger, T. W. Hänsch, and I. Bloch, “Quantum Phase Transition from a Superfluid to a Mott Insulator in a Gas of Ultracold Atoms,” Nature 415, 39–44 (2002), doi:10.1038/415039a.
- R. Grimm, M. Weidemüller, and Y. B. Ovchinnikov, “Optical Dipole Traps for Neutral Atoms,” Advances in Atomic, Molecular, and Optical Physics 42, 95–170 (2000), doi:10.1016/S1049-250X(08)60186-X.
- D. Jaksch, C. Bruder, J. I. Cirac, C. W. Gardiner, and P. Zoller, “Cold Bosonic Atoms in Optical Lattices,” Physical Review Letters 81, 3108–3111 (1998), doi:10.1103/PhysRevLett.81.3108.
- R. Jördens, N. Strohmaier, K. Günter, H. Moritz, and T. Esslinger, “A Mott Insulator of Fermionic Atoms in an Optical Lattice,” Nature 455, 204–207 (2008), doi:10.1038/nature07244.
- M. Köhl, H. Moritz, T. Stöferle, K. Günter, and T. Esslinger, “Fermionic Atoms in a Three Dimensional Optical Lattice: Observing Fermi Surfaces, Dynamics, and Interactions,” Physical Review Letters 94, 080403 (2005), doi:10.1103/PhysRevLett.94.080403.
- M. Lewenstein, A. Sanpera, V. Ahufinger, B. Damski, A. Sen De, and U. Sen, “Ultracold Atomic Gases in Optical Lattices: Mimicking Condensed Matter Physics and Beyond,” Advances in Physics 56, 243–379 (2007), doi:10.1080/00018730701223200.
- A. Mazurenko, C. S. Chiu, G. Ji, M. F. Parsons, M. Kanász-Nagy, R. Schmidt, F. Grusdt, E. Demler, D. Greif, and M. Greiner, “A Cold-Atom Fermi–Hubbard Antiferromagnet,” Nature 545, 462–466 (2017), doi:10.1038/nature22362.
- O. Morsch and M. Oberthaler, “Dynamics of Bose–Einstein Condensates in Optical Lattices,” Reviews of Modern Physics 78, 179–215 (2006), doi:10.1103/RevModPhys.78.179.
- Y. B. Ovchinnikov, J. H. Müller, M. R. Doery, E. J. D. Vredenbregt, K. Helmerson, S. L. Rolston, and W. D. Phillips, “Diffraction of a Released Bose–Einstein Condensate by a Pulsed Standing Light Wave,” Physical Review Letters 83, 284–287 (1999), doi:10.1103/PhysRevLett.83.284.
- U. Schneider, L. Hackermüller, S. Will, T. Best, I. Bloch, T. A. Costi, R. W. Helmes, D. Rasch, and A. Rosch, “Metallic and Insulating Phases of Repulsively Interacting Fermions in a 3D Optical Lattice,” Science 322, 1520–1525 (2008), doi:10.1126/science.1165449.
- J. F. Sherson, C. Weitenberg, M. Endres, M. Cheneau, I. Bloch, and S. Kuhr, “Single-Atom-Resolved Fluorescence Imaging of an Atomic Mott Insulator,” Nature 467, 68–72 (2010), doi:10.1038/nature09378.
- T. Stöferle, H. Moritz, C. Schori, M. Köhl, and T. Esslinger, “Transition from a Strongly Interacting 1D Superfluid to a Mott Insulator,” Physical Review Letters 92, 130403 (2004), doi:10.1103/PhysRevLett.92.130403.
- W. Zwerger, “Mott–Hubbard Transition of Cold Atoms in Optical Lattices,” Journal of Optics B: Quantum and Semiclassical Optics 5, S9–S16 (2003), doi:10.1088/1464-4266/5/2/352.