

Autler–Townes Splitting
Autler–Townes splitting is the appearance of two spectroscopic resonances when a strong coherent field couples two states that would otherwise contribute one probe resonance. In the simplest resonant case, the separation approaches the control-field Rabi frequency:
The statement is asymptotic, not definitional. A Hamiltonian may have two dressed eigenvalues before an experiment resolves two peaks, and a narrow transparency dip can appear through interference even when the response poles have not split. A trustworthy interpretation therefore combines:
- the control-dressed eigenvalues and matrix elements;
- a weak-probe open-system response;
- linewidth, Doppler, propagation, and instrument models;
- explicit alternatives such as power broadening and electromagnetically induced transparency.
The effect was introduced in microwave spectroscopy by Autler and Townes in 1955 and is also called resonant dynamic Stark splitting. It now appears in atomic, molecular, solid-state, cavity, circuit, and Rydberg-field spectroscopy.
Required background. Dressed States supplies mixing angles and transition strengths; Optical Bloch Equations supplies coherence decay; Line Shapes and Broadening defines linewidth conventions and convolution.
Probe–Control Ladder
Section titled “Probe–Control Ladder”States and fields
Section titled “States and fields”Use a ladder with energies
and transition frequencies
A weak probe of angular frequency couples with Rabi-frequency coefficient . A stronger control of angular frequency couples with coefficient .
Use atom-minus-field detunings
and the ladder two-photon detuning
Thus red detuning is positive. Frequency variables use angular units; decay rates are inverse times. A coherence decay rate corresponds to a Lorentzian angular-frequency HWHM .
Rotating-frame Hamiltonian
Section titled “Rotating-frame Hamiltonian”Choose phases so both Rabi coefficients are real and nonnegative. In the ordered basis
the rotating-wave Hamiltonian is
This model assumes:
- the two fields address only the displayed transitions;
- both rotating-wave approximations are controlled;
- the probe is weak enough for linear response;
- a single velocity, position, polarization pathway, and control amplitude are considered before ensemble averaging;
- dissipation can be represented by Markovian coherence rates.
For constant optical phases, an open chain has enough state-phase freedom to make both couplings real. Time-dependent rephasing also changes diagonal detunings through its time derivative. A closed loop driven on all three transitions can retain an observable loop phase and requires a different analysis.
Control-Dressed Resonances
Section titled “Control-Dressed Resonances”Strong-coupling subspace
Section titled “Strong-coupling subspace”In the weak-probe limit, set while retaining the probe frequency as the scanned reference. The coupled subblock is
Its eigenvalues relative to the uncoupled quasienergy are
where
The weak probe becomes resonant when one dressed branch is degenerate with :
Therefore the ideal resonance detunings are
Their separation and midpoint are
and
For resonant control,
the ideal pair lies at
so its separation is .
Probe matrix elements
Section titled “Probe matrix elements”Define the control mixing angle by
After removing the common energy and ordering the control-coupled basis as , one convenient choice is
Because the probe couples to the component, the ideal squared matrix-element weights associated with the algebraic roots above are
Here accompanies the root
not the upper quasienergy label . This explicit convention avoids a common branch-label swap.
At control resonance, . For large positive , the near-zero probe root has , while the far root becomes weak. Peak heights need not equal these weights because decay, populations, interference, optical depth, and the detection channel also enter.
Far-detuned limit
Section titled “Far-detuned limit”If
then
The bright near-zero root becomes
whereas the weak remote root lies near
The near root is positive in atom-minus-field detuning, so the physical probe frequency shifts downward by . This is the AC Stark lowering of by a red-detuned upper-transition field. Autler–Townes splitting and perturbative light shifts are therefore the resonant and far-detuned limits of the same avoided crossing, but different language is useful in the two regimes.
Weak-Probe Response
Section titled “Weak-Probe Response”Coherence decay rates
Section titled “Coherence decay rates”Let:
- be the decay rate of the probe coherence ;
- be the decay rate of the two-photon coherence .
These are homogeneous angular-frequency HWHM parameters in the coherence equations. They can include population decay and pure dephasing. For example, in a simple model,
with an analogous expression for , for independent irreversible loss channels. Pure-dephasing rates must arise from a consistent positive noise/master-equation model; arbitrary pairwise assignments need not define a physical three-level generator.
Linearized optical Bloch equations
Section titled “Linearized optical Bloch equations”Assume a stable, initially occupied and a weak probe, with no independent pump or accumulating loss into unmodeled dark states, so that
To first order in , the slowly varying coherences obey
The control creates a second coherence path. Solving the steady equations gives
With this phase convention, define the normalized absorption proxy
For the positive-frequency convention , the physical susceptibility is proportional to , rather than to : the Hamiltonian’s positive coupling has absorbed the minus sign of . In a scalar channel,
Thus the absorption proxy has the correct positive sign; one must also conjugate and change sign when calculating dispersion. With no control,
which is one homogeneous Lorentzian.
Resonant-control profile
Section titled “Resonant-control profile”Set , so , and define
The absorption proxy becomes
At line center,
Relative to the no-control line-center absorption,
This formula is central to the EIT distinction. If is very small, substantial line-center transparency can occur for a control that is too weak to create split response poles.
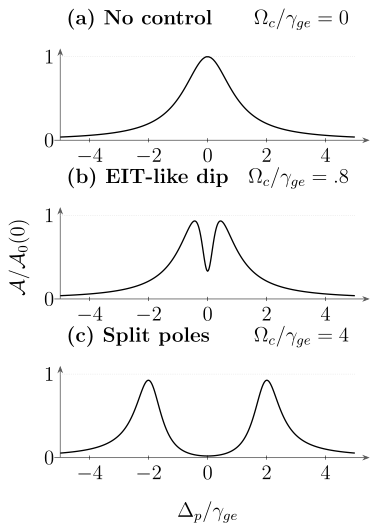
Weak-probe absorption from the resonant three-level model with , plotted on the same vertical scale in three panels. The middle trace has a central interference dip although its poles are not split; the stronger control produces a resolved Autler–Townes doublet. A dip and a split pole pair are different conditions.
Poles, Peaks, and Resolvability
Section titled “Poles, Peaks, and Resolvability”Complex response poles
Section titled “Complex response poles”For resonant control, the displayed denominator has complex poles
The poles acquire distinct real parts when
The conjugate coherence giving the causal susceptibility has conjugate poles as a function of ; its physical-frequency poles lie in the lower half-plane. The real-part separation and decay magnitudes are the same.
This is a useful pole-splitting criterion for the stated linear, resonant, homogeneous model. It is not a universal experimental resolution criterion.
In the strong-control limit,
the pole separation approaches , and each isolated component has an approximate pole HWHM
The actual maximum of can differ from the real part of a pole when the components overlap or their residues interfere. Near the crossover, fitting two independent Lorentzians and calling their fitted distance “the Rabi frequency” can be biased.
What counts as resolved
Section titled “What counts as resolved”Two peaks are experimentally resolved only relative to a stated forward model and noise level. Relevant scales include:
- homogeneous component widths;
- Doppler and other inhomogeneous distributions;
- spatial variation of ;
- probe-laser and control-laser noise;
- instrument response and scan calibration;
- optical depth and propagation;
- background, sampling interval, and signal-to-noise ratio.
A conservative strong-splitting statement is
where the last two symbols summarize inhomogeneous and instrumental scales. The symbol deliberately avoids pretending that one Rayleigh-like number applies to every line shape and estimator.
Peak separation is not always the eigenvalue gap
Section titled “Peak separation is not always the eigenvalue gap”In the lossless model,
In data, one may instead quote:
- the difference between local maxima;
- the difference between fitted component centers;
- the real-part separation of response poles;
- the Hamiltonian dressed-state gap.
These quantities approach each other in the strong-control, negligible-loss limit for the same detuning and chosen detection channel. They need not agree near threshold. A publication or calibration should say which one was used.
Difference from Power Broadening
Section titled “Difference from Power Broadening”Ordinary two-level power broadening concerns one transition driven and observed in the same saturated response. In the convention of Optical Bloch Equations, its FWHM is
The center remains one resonance in the ideal model, while the response flattens and widens with intensity.
Autler–Townes spectroscopy instead uses a strong control to couple one transition and a weak probe to interrogate a connected transition. In the well-resolved regime:
- power broadening: one wider component;
- Autler–Townes splitting: two dressed components.
Real data can contain both. Control noise or additional transitions can broaden and decohere the dressed components; an ideal coherent control does not itself add a decoherence rate. The probe can saturate if it is not weak, and optical pumping can redistribute population. The correct comparison is therefore between forward models, not between the words “broad” and “split.”
Difference from EIT
Section titled “Difference from EIT”Two mechanisms for a central dip
Section titled “Two mechanisms for a central dip”Autler–Townes splitting and electromagnetically induced transparency can both produce reduced absorption near the center of a probe line.
Autler–Townes mechanism. A strong control separates two absorptive response poles. The low absorption between them is primarily the valley between resolved resonances.
EIT mechanism. Coherent excitation pathways interfere destructively at two-photon resonance. A narrow transparency window can be carved inside an otherwise unsplit broad resonance.
For the resonant model above, deep line-center suppression requires
Pole splitting requires
When
there can be a broad interval in which the first condition is satisfied but the second is not. A narrow, high-contrast dip in that interval is interference dominated rather than a resolved Autler–Townes doublet.
Crossover, not a universal border
Section titled “Crossover, not a universal border”The two limiting pictures are valuable, but not every spectrum belongs unambiguously to one category. Multilevel degeneracy, unequal decay paths, Doppler averaging, optical depth, and finite resolution move the crossover. In an intermediate regime, both dressed-pole separation and interference shape the same response.
A responsible analysis can:
- fit the full complex susceptibility derived from the physical level scheme;
- compare constrained EIT-like and ATS-like reduced models;
- use an information criterion or predictive validation rather than raw residual size alone;
- report when the evidence is inconclusive.
The Akaike-information approach introduced by Anisimov, Dowling, and Sanders and tested in cold cesium by Giner and collaborators is one such model-comparison strategy. It does not remove the need to model the actual level structure and experimental convolution.
Configuration matters
Section titled “Configuration matters”For a Λ system, the two-photon coherence connects two long-lived lower states and can have
That hierarchy strongly favors a narrow EIT window.
For a ladder, the two-photon coherence includes the upper-state lifetime and may decay more rapidly. For a V system, the relevant upper-state coherence, shared ground state, and control-induced population changes alter the response. It is unsafe to transfer one ATS/EIT threshold among Λ, ladder, and V schemes without rederiving the coherence equations.
Detuned and Asymmetric Doublets
Section titled “Detuned and Asymmetric Doublets”Control detuning does three things:
- increases the ideal branch separation from to ;
- moves the pair midpoint to in the present convention;
- makes the probe matrix-element weights unequal.
The two roots satisfy the invariants
and
These relations are useful calibration checks. A common-mode scan offset changes the measured sum but not the separation. An incorrect detuning sign reverses the expected motion of the midpoint and strength exchange.
Asymmetry can also arise from:
- unequal dressed-state matrix elements;
- unequal decay and branching;
- nearby spectator states;
- polarization-dependent Clebsch–Gordan coefficients;
- control-induced optical pumping;
- Doppler selection;
- dispersive detection or interference with a background field.
Therefore asymmetric peaks do not, by themselves, prove control detuning.
What the Detector Measures
Section titled “What the Detector Measures”Absorption and transmission
Section titled “Absorption and transmission”In a dilute, uniform, weak-probe medium,
For propagation length ,
At small optical depth,
At larger optical depth, a Lorentzian absorption coefficient does not produce a Lorentzian transmission curve. Fitting transmission directly with a sum of Lorentzians can distort widths and areas.
Dispersion and phase
Section titled “Dispersion and phase”The real part of the susceptibility changes the probe phase and group delay. A central absorption minimum can coexist with steep dispersion. That dispersion is central to EIT applications, but an Autler–Townes doublet also has dispersive structure. A measured phase slope alone does not establish a dark state.
Fluorescence and population readout
Section titled “Fluorescence and population readout”Fluorescence often measures an excited-state population times branching, collection efficiency, and detector response:
It is not generally proportional to . State ionization, loss, shelving, and quantum-jump counts define still other observables. A spectrum can show peaks in one channel and dips in another without contradicting the same dressed dynamics.
Convolution and sampling
Section titled “Convolution and sampling”A practical forward model may be written schematically as
where the convolution means
Here is a baseline, is the instrument response, is the predicted absorption, transmission, or count signal, and is noise. Scan-axis calibration and point spacing affect the inferred response parameters and must be included.
Motion and Spatial Averaging
Section titled “Motion and Spatial Averaging”Doppler detunings
Section titled “Doppler detunings”For an atom of velocity , the observed field frequencies are Doppler shifted. With the atom-minus-field convention,
and
For the ladder,
The vector signs include beam direction. Counter-propagating beams can reduce the two-photon Doppler width when their wave-vector magnitudes are similar; unequal wavelengths leave a residual.
The ensemble response is
At each position, intermingled velocity classes contribute to this local complex susceptibility before propagation is calculated. Distinct transverse rays are different: a detector that collects their powers averages the transmitted intensities after propagation. Averaging fitted peak centers implements neither operation.
Control-beam profile
Section titled “Control-beam profile”For electric-dipole coupling,
A Gaussian control beam produces a distribution of local splittings. In an optically thin fluorescence or absorbed-power measurement, the observed signal can be weighted by probe intensity, density, detection efficiency, and optical pumping:
Using peak control intensity when the experiment measures a spatial average biases an inferred dipole moment or electric field. At appreciable optical depth, solve propagation along each ray and then integrate the detected power; the displayed linear volume integral is insufficient.
Transit and pulse effects
Section titled “Transit and pulse effects”Steady-state formulas require interaction times long compared with the relevant coherence-settling times. Short pulses add Fourier width and can create transient Rabi ringing. Moving particles can sample a time-dependent control envelope even under continuous illumination. A pulsed Autler–Townes experiment should solve the time-dependent density matrix and model the detector gate.
Multilevel and Polarization Effects
Section titled “Multilevel and Polarization Effects”Real atoms and molecules rarely provide one isolated ladder. The control may couple several Zeeman, hyperfine, rotational, or vibrational states:
Different angular factors produce several splittings. Unresolved components can broaden, skew, or multiply the observed lines.
The relevant coupled subspace includes all states whose resonant or virtual contributions matter at the desired precision. A separation of several linewidths alone does not bound a spectator’s light shift. Propagate optical pumping when it changes magnetic-sublevel populations; angular factors and polarization impurities then enter both the energies and the line weights.
For precision electrometry, ambiguity among magnetic-sublevel transition moments can dominate the calibration. Isolating one angular-momentum pathway is often more valuable than merely increasing signal.
Extracting Couplings and Fields
Section titled “Extracting Couplings and Fields”Rabi frequency from a splitting
Section titled “Rabi frequency from a splitting”In the resolved weak-probe regime, fit the generalized relation
where is the dressed gap or a justified estimator of it. At nominal resonance,
Near the resolution threshold, use the full response rather than replacing by the distance between raw local maxima.
Transition dipole moment
Section titled “Transition dipole moment”For a linearly polarized peak electric field ,
If the measured splitting in cycles per second is
then
The field must be the local field at the sample, not merely one inferred from laser power before windows, focusing, standing waves, or cavity enhancement.
Electric-field sensing and the scan axis
Section titled “Electric-field sensing and the scan axis”If the transition dipole is known, the same equation measures a resonant electric field:
Rydberg transitions have large dipole moments, useful for radio-frequency and microwave electrometry. Optical readout commonly uses four levels: the optical probe and coupling beams reach one Rydberg state, and the RF field couples it to another. An optical scan need not directly measure the RF dressed gap. In the usual counterpropagating, velocity-selected warm-vapor probe scan, for example,
The wavelength factor follows from the velocity class selected by the resonant probe and is absent for stationary atoms; it is not a universal correction for every scan geometry (Holloway and colleagues). Use a velocity-averaged four-level response outside that resolved limit. A traceable measurement also requires:
- correct state and angular factor;
- local-field and polarization characterization;
- frequency-axis traceability;
- a validated splitting estimator;
- treatment of cell perturbations, standing waves, and field gradients;
- uncertainty propagation for theoretical matrix elements.
Square-root intensity test
Section titled “Square-root intensity test”For a plane wave,
Therefore
and, at fixed detuning,
A linear fit of against calibrated local intensity separates a detuning intercept from the coupling slope. Deviations can reveal saturation of the readout, changing beam size, multilevel crossings, or an incorrect peak estimator.
The same dressing mechanism appears in molecular double-resonance spectroscopy and solid-state few-level systems, but their population, dephasing, and detection models differ. Rydberg Electrometry develops local-field inference and calibration; Cavity QED adds quantized-mode fluctuations and input–output interference. A weak cavity doublet alone also has a classical linear-oscillator description; photon-number-resolved nonlinearities provide different information.
Exercises
Section titled “Exercises”1. A central minimum is not a split pole
Section titled “1. A central minimum is not a split pole”Expand the resonant-control about , with . Find the condition for positive curvature. Compare it with the split-pole condition when .
Solution
Using the defined above,
A local minimum therefore requires
For the stated ratio this is , far below the pole-splitting threshold . The emerging dip can be very shallow: its existence does not imply deep transparency or a resolved dressed doublet.
2. Convert a Rydberg splitting into electric field
Section titled “2. Convert a Rydberg splitting into electric field”For stationary atoms, a resonant microwave field produces an inferred dressed-gap splitting (with any optical scan conversion already applied)
The relevant projected dipole moment is
Find the peak electric field and its standard uncertainty, neglecting correlations and all other systematics. Use
and
Solution
Because the measured splitting is in cycles per second,
The dipole is
Using
the numerator is
Therefore
For independent uncertainties,
Thus
The result under the restricted assumptions is
A real uncertainty budget must add state purity, polarization, local-field, line-shape, scan-axis, and matrix-element model uncertainties.
3. Derive the weak-probe coherence
Section titled “3. Derive the weak-probe coherence”Starting from
solve for . Check the result when .
Solution
The second equation gives
Insert this into the first equation:
Multiplying numerator and denominator by yields
When , the factor cancels:
Its imaginary part is
the expected positive Lorentzian absorption proxy.
4. Classify split poles and transparency
Section titled “4. Classify split poles and transparency”Suppose
- Find the resonant-control pole-splitting threshold.
- Find the scale at which line-center suppression becomes appreciable.
- Classify controls with and .
- For the stronger control, calculate the real pole separation and pole HWHM in megahertz.
Solution
All rates contain the same factor of , so the comparisons can be made using their values in megahertz.
The split-pole threshold is
The interference-suppression scale is
The control exceeds the transparency scale but is below the split-pole threshold. It can produce an EIT-like central dip, but not two poles with distinct real parts in this model.
The control exceeds the threshold and lies in the Autler–Townes regime. Its real pole separation is
The pole HWHM is
Whether the two maxima are cleanly resolved still depends on the numerator, inhomogeneous width, and instrument response.
5. Detuned doublet positions and strengths
Section titled “5. Detuned doublet positions and strengths”Take
Neglect decay. Find the generalized splitting, both probe resonance detunings, the midpoint, and the ideal squared matrix-element weights and .
Solution
The generalized splitting is
The roots are
and
Their midpoint is . The weights are
The near-zero resonance is bright and the far resonance is weak. A large eigenvalue separation therefore need not yield two peaks of comparable visibility.
6. Deep transparency without split poles
Section titled “6. Deep transparency without split poles”Let
in common angular-frequency units.
- For , calculate the ratio .
- Find the minimum that suppresses line-center absorption by .
- Compare that value with the pole-splitting threshold.
Solution
The center ratio is
Here
and , so
For suppression, require :
This gives
so
The split-pole threshold is
Thus a central transparency can occur at even though the poles are not split. The dip is interference dominated in this regime.
7. Two-photon Doppler width
Section titled “7. Two-photon Doppler width”A ladder uses a probe and a control. For a one-dimensional velocity RMS of
estimate the RMS two-photon Doppler width in hertz for:
- co-propagating beams;
- counter-propagating beams.
Treat both quoted wavelengths as vacuum wavelengths.
Solution
In cycles per second, the two-photon Doppler coefficient is the signed sum of inverse wavelengths:
where encode beam directions.
For co-propagating beams,
For counter-propagating beams,
Counter-propagation reduces the two-photon Doppler width by about a factor of , but it does not cancel it because the wavelengths differ.
8. Compare positions and areas
Section titled “8. Compare positions and areas”Two well-separated probe features are fitted at
Assume the ideal lossless ladder model.
- Infer and .
- Predict the ideal squared matrix-element weight ratio for the and roots.
- An experiment instead reports an integrated-area ratio . Explain what can and cannot be concluded.
Solution
The root sum gives
Therefore
The separation is
Hence
The positive root has
while the negative root has
The ideal squared matrix-element ratio is therefore
not .
The positions remain consistent with one effective coupling and detuning, but the area discrepancy shows that the simplest identification of integrated area with dressed weight is invalid. Possible causes include dressed populations, branching, optical depth, interference, polarization-dependent pathways, unresolved sublevels, background, or detector response. Unequal widths alone alter peak heights, not the integrated strengths of independent normalized absorption lines. Effects that change the areas may also shift maxima, so the position-based inference must be checked again in the expanded model rather than assumed valid.
References
Section titled “References”- T. Y. Abi-Salloum, “Electromagnetically induced transparency and Autler–Townes splitting: Two similar but distinct phenomena in two categories of three-level atomic systems,” Physical Review A 81, 053836 (2010).
- P. M. Anisimov, J. P. Dowling, and B. C. Sanders, “Objectively discerning Autler–Townes splitting from electromagnetically induced transparency,” Physical Review Letters 107, 163604 (2011); arXiv:1102.0546.
- S. H. Autler and C. H. Townes, “Stark effect in rapidly varying fields,” Physical Review 100, 703–722 (1955).
- C. Cohen-Tannoudji, J. Dupont-Roc, and G. Grynberg, Atom–Photon Interactions: Basic Processes and Applications (Wiley, 1992).
- M. Fleischhauer, A. Imamoglu, and J. P. Marangos, “Electromagnetically induced transparency: Optics in coherent media,” Reviews of Modern Physics 77, 633–673 (2005).
- B. D. Gerardot, D. Brunner, P. A. Dalgarno, K. Karrai, A. Badolato, P. M. Petroff, and R. J. Warburton, “Dressed excitonic states and quantum interference in a three-level quantum dot ladder system,” New Journal of Physics 11, 013028 (2009); arXiv:0803.0432.
- L. Giner, L. Veissier, B. Sparkes, A. S. Sheremet, A. Nicolas, O. S. Mishina, M. Scherman, S. Burks, I. Shomroni, D. V. Kupriyanov, P. K. Lam, E. Giacobino, and J. Laurat, “Experimental investigation of the transition between Autler–Townes splitting and electromagnetically-induced- transparency models,” Physical Review A 87, 013823 (2013); arXiv:1206.5921.
- C. L. Holloway, J. A. Gordon, S. Jefferts, A. Schwarzkopf, D. A. Anderson, S. A. Miller, N. Thaicharoen, and G. Raithel, “Broadband Rydberg atom-based electric-field probe: From self-calibrated measurements to sub-wavelength imaging,” arXiv:1405.7066 (2014), Eq. (12).
- A. Sanli, X. Pan, S. Magnier, J. Huennekens, A. M. Lyyra, and E. H. Ahmed, “Measurement of the and transition dipole moments using optical–optical double resonance and Autler–Townes spectroscopy,” Journal of Chemical Physics 147, 204301 (2017).
- N. Schlossberger, N. Prajapati, A. Artusio-Glimpse, S. Berweger, M. Simons, W. Watterson, D. Shylla, and C. Holloway, “Calibration of Autler–Townes based electrometry in Rydberg states of alkali atoms,” 2024 Conference on Precision Electromagnetic Measurements (2024); NIST record.
- B. W. Shore, The Theory of Coherent Atomic Excitation (Wiley, 1990).