

Rydberg Electrometry
A Rydberg electrometer infers an electric-field property from the large dipole response of a highly excited atom. In the most common vapor-cell implementation, two optical fields create Rydberg electromagnetically induced transparency (EIT), a radio-frequency field couples the addressed Rydberg state to a neighboring state, and probe transmission supplies the data. The familiar Autler–Townes formula can then convert a resolved spectral splitting into a local field amplitude.
That one-line conversion is the middle of a measurement, not its beginning or end. A complete result must say which field component and amplitude convention are estimated, how a laser scan maps onto an atomic energy interval, how the glass cell changes the incident field, which atoms and positions contribute, and how the recorded photons determine an uncertainty. These distinctions are especially important when the splitting is unresolved, the field is detuned, or the desired measurand is the field outside the cell.
Required background. Rydberg atoms provides transition dipoles and level spacings; EIT explains the optical dark resonance; Autler–Townes splitting distinguishes dressed gaps from observed peaks. Parameter estimation supplies the likelihood and uncertainty calculation.
Electric-field amplitudes and optical readout
Section titled “Electric-field amplitudes and optical readout”For a nearly monochromatic field, write the real field as
is a peak complex phasor. For a linearly polarized sinusoid, . Autler–Townes Rabi frequencies below use the peak convention. For elliptical polarization, define the phasor norm by . It equals , but need not equal the maximum instantaneous vector magnitude. This distinction matters when comparing linear and circular polarization.
Four-Level RF-to-Optical Transducer
Section titled “Four-Level RF-to-Optical Transducer”States, fields, and detunings
Section titled “States, fields, and detunings”Use a ladder with probe and coupling Rabi coefficients and . A field near angular frequency couples to a higher Rydberg state with coefficient . The displayed ladder assumes ; a downward RF transition requires the corresponding rotating-frame and phasor-conjugation changes. Define atom-minus-field detunings
and cumulative detunings
Angular frequencies are used unless is written explicitly. In a rotating-wave frame, one convenient Hamiltonian is
The model is useful only after specifying the states hidden inside each label. Hyperfine and Zeeman sublevels, unwanted polarization components, nearby Rydberg manifolds, and off-resonant couplings can turn one four-state diagram into many interfering pathways.
The projected RF coupling
Section titled “The projected RF coupling”For peak phasor and a selected transition,
Its magnitude is
The sign and complex phase matter in a closed-loop or coherent-mixing experiment, even though an isolated splitting depends only on . The rotating-wave approximation also requires the counter-rotating and neighboring-transition corrections to remain small on the required uncertainty scale.
Weak-probe optical response
Section titled “Weak-probe optical response”For Markovian coherence damping in the weak-probe limit, . Solving the three linear equations for , , and gives a continued fraction. With coherence half-widths , , and ,
This expression displays the nested transduction: the RF field changes a Rydberg coherence, the coupling field maps that change onto the optical coherence, and propagation maps the coherence onto transmitted light. It is not a universal vapor-cell fit function. Saturation, optical pumping, additional levels, velocity changes during transit, and propagation through appreciable optical depth require optical Bloch or master-equation modeling.
For a scalar probe polarization with peak phasor , use and positive-frequency dependence . If is number density, the physical susceptibility is
The minus sign comes from and the conjugation from the positive-frequency polarization. Consequently , whereas the real parts have opposite signs. Confusing the coherence with preserves this absorption proxy but reverses dispersion.
For a dilute homogeneous slice with , negligible reflections, and a spatially uniform unsaturated response, the intensity transmission is
If spectral bin records a photon count , a basic detector model is
where collects laser power, detunings, linewidths, background, gain, and other nuisance parameters. Fitting peak positions is one possible estimator. A correctly specified full-line-shape likelihood can retain information lost by peak picking, especially near the resolution boundary; a more detailed but incorrect model need not reduce bias.
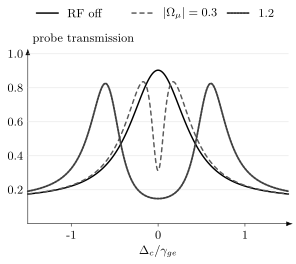
Response calculated from the continued fraction, not from fitted Gaussian peaks. The probe and RF are resonant, while the coupling laser is scanned. In units of , take , , and . The RF-off transparency peak becomes a narrow central dip and then two separated transmission peaks as increases. The single-velocity, uniform-field model illustrates why a spectral change can be measurable before two peak positions give a reliable field estimate. Thermal and spatial averaging are omitted.
Resolved Autler–Townes Electrometry
Section titled “Resolved Autler–Townes Electrometry”Resonant and detuned dressed gaps
Section titled “Resonant and detuned dressed gaps”Ignore the weak optical probe momentarily and diagonalize the RF-coupled Rydberg pair. Relative to , its rotating-frame block can be written
The dressed shifts are
so the eigenvalue gap is
On resonance, . If a justified spectral estimator returns the corresponding splitting in hertz, then
This direct conversion applies to the local, projected, peak field when the RF is resonant and the observed peak separation is a valid estimator of the dressed gap. Off resonance,
Near the resolution threshold, raw local maxima need not coincide with the real parts of the response poles. The full line shape should then determine and jointly.
The scan-axis correction
Section titled “The scan-axis correction”The atomic gap and the separation on a plotted laser-frequency axis are not always equal. Let a moving atom have signed axial wave vectors and . Its optical detunings are
When the coupling laser is scanned while a resonant probe selects atoms near , the coupling-axis separation directly gives
in the ideal resonant limit. If instead the probe is scanned and the coupling frequency is held fixed, the strongly absorbing velocity class approximately satisfies . For counter-propagating beams this gives
and therefore
Thus a probe-axis splitting must be divided by before applying the atomic conversion. This result follows from the stated scan and propagation conventions; a memorized wavelength factor can be inverted by changing either one. Finite linewidth, optical pumping, temperature, and multilevel structure can also modify the simple selected-velocity argument, so precision work should fit the velocity-averaged response.
Below the Resolved-Splitting Regime
Section titled “Below the Resolved-Splitting Regime”Line-shape estimation
Section titled “Line-shape estimation”A field does not become undetectable merely because two peaks cannot be resolved. It can change the EIT depth, width, curvature, or phase. For independent Poisson spectral bins, the classical Fisher information for a field parameter is
With nuisance parameters , an invertible full Fisher matrix gives the local bound for an estimator locally unbiased in the field and nuisance directions,
not from while pretending that laser detuning and contrast are known. The best probe detuning is usually where the expected signal changes steeply and reproducibly, not necessarily at line center. Modulation and balanced or homodyne optical readout can move the estimate away from low-frequency laser noise, but their duty cycle and reference noise belong in the comparison.
If the observable is even in an unknown field, its small-field response may begin as
Then at . In a regular likelihood with positive noise floor, field-amplitude Fisher information vanishes there, although can still be estimable. A signed field and its negative are indistinguishable in this response; a nonnegative amplitude at zero is a parameter boundary, where the usual unbiased Cramér–Rao reasoning needs care. A known bias or coherent local oscillator restores a linear term.
Atomic homodyne and heterodyne mixing
Section titled “Atomic homodyne and heterodyne mixing”Let a strong local oscillator and a weak signal address the same effective Rydberg transition:
Assume the LO and signal have the same polarization projection and spatial mode. For and , the field-envelope magnitude is
If the modulation is slow enough for a quasistatic optical response , linearization gives
The atoms now down-convert the signal to an intermediate-frequency optical beat note. At nonzero IF, two calibrated demodulation phases estimate and ; the beat amplitude estimates . At zero IF, one fixed homodyne phase measures only one quadrature. Near the response bandwidth, replace the real static slope by a calibrated complex frequency response, including its attenuation and phase lag. This extends detection below the resolved Autler–Townes regime and enables coherent reception. The result is not reference-free: local-oscillator amplitude, phase noise, spatial overlap, and detuning are resources and nuisance parameters.
Resonant, Off-Resonant, and Static Fields
Section titled “Resonant, Off-Resonant, and Static Fields”Rydberg electrometry spans several physical responses. They should not be collapsed into one calibration formula.
| Regime | Dominant observable | Leading field dependence | Information lost without a reference |
|---|---|---|---|
| resonant RF, resolved | Autler–Townes gap | absolute carrier phase | |
| resonant RF, unresolved | EIT line shape or mixer beat | model dependent; linear with a coherent bias | phase or sign in an intensity-only measurement |
| far-detuned RF | differential AC Stark shift | sign and generally carrier phase | |
| static or quasistatic | differential DC Stark shift | absent a bias | field sign |
For a nondegenerate state with scalar static polarizability ,
The measured transition shift is set by the differential polarizability,
For a far-off-resonant sinusoid with peak amplitude , the cycle average introduces another factor of :
Tensor polarizability, near-degenerate mixing, and strong fields require a Stark-map or Floquet calculation rather than these scalar formulas. The canonical derivations are on Stark Effect in Atoms and Dynamic Polarizability.
A known static bias can linearize a small perturbation :
It also imports bias calibration and drift. In glass alkali-vapor cells, surface charge can screen low-frequency external fields or create inhomogeneous offsets, so the field at the atoms must be measured or modeled rather than inferred from electrode voltage alone.
Polarization and Vector Reconstruction
Section titled “Polarization and Vector Reconstruction”Choose a quantization axis and spherical basis , . Expand the RF phasor using coefficients
Define the standard tensor operators , . With these definitions, : the field expansion coefficients use the conjugated basis, whereas the tensor operators do not. For one angular-momentum pathway,
with
Selection rules therefore make the spectrum a polarization-dependent sum of pathways, not a direct meter of . Optical pumping changes their weights. Some populated states may be uncoupled and leave an unsplit central feature; others have different dipole moments and broaden or resolve the doublet.
A vector measurement needs enough independent settings to identify the desired phasor parameters. Schematically,
Rotating a known quantization axis, changing optical polarizations, resolving Zeeman components, or using multiple transitions can provide independent constraints. The Jacobian with respect to the estimated field components must identify the desired field directions after accounting for nuisance parameters. Intensity-only spectra are unchanged by a common phasor phase; absolute phase requires a coherent reference. Local rank also does not eliminate discrete, globally indistinguishable solutions. Measuring three peak separations is not automatically a three-dimensional vector measurement if the same unknown polarization impurity affects all three.
Thermal Motion and Spatial Transfer
Section titled “Thermal Motion and Spatial Transfer”Velocity averaging
Section titled “Velocity averaging”For velocity distribution , the susceptibility of a dilute thermal ensemble begins with
Counter-propagating probe and coupling beams reduce the residual two-photon Doppler wave vector , but unequal wavelengths prevent perfect cancellation in the common two-photon ladder. Beam angle, transit time, collisions, laser linewidth, and velocity-changing processes further modify the response. Three-photon ladders can be arranged with a smaller net wave vector, trading additional lasers and levels for narrower Doppler response.
The field inside a vapor cell
Section titled “The field inside a vapor cell”At carrier frequency , write the local field as
can include dielectric boundary conditions, standing waves, nearby conductors, electrodes, supports, resonators, and polarization rotation. At low frequency it can include charge transport and screening. It is generally a complex, position-dependent tensor rather than a single scalar correction. This linear map assumes fixed material response and geometry; field-dependent surface charge or nonlinear response requires a more general forward model.
The detected spectrum is weighted by probe and coupling intensities and by atomic trajectories. A schematic forward model is
where the notation only summarizes the operations: the susceptibility must first be averaged over the relevant local velocity distribution, then propagated along each optical path, before detector pixels or modes are combined. These operations generally cannot be interchanged. Nor can an inhomogeneous RF field usually be replaced by its spatial mean. A field gradient may instead produce broadening, unequal peaks, or several peaks.
A fitted local amplitude is therefore an effective parameter of the chosen spatial model, not automatically the arithmetic mean field. An external-field estimate additionally needs a sufficiently identifiable electromagnetic transfer model. A single projected local measurement cannot invert an arbitrary three-component transfer tensor.
A subwavelength optical spot can localize the readout more finely than the RF wavelength, but spatial resolution is set by the full weighting kernel, including beam waist, depth of field, atomic motion, camera pixels, and inverse regularization. It is not simply the cell size.
Sensitivity, Bandwidth, and Dynamic Range
Section titled “Sensitivity, Bandwidth, and Dynamic Range”Averaging-time sensitivity
Section titled “Averaging-time sensitivity”For total averaging time in a stationary white-noise regime, define
where has units and includes cycle overhead when is elapsed time. This coefficient is defined by estimator averaging, not by a one-sided PSD. A continuous white-noise record with rectangular averaging has one-sided amplitude spectral density . Comparisons need the same local or external field, peak or RMS convention, carrier and modulation frequencies, spatial mode, and observation time.
For a resolved resonant splitting,
before scan-axis, detuning, and transfer uncertainties. This relation converts a splitting-estimator uncertainty; it does not predict that uncertainty. Photon shot noise, laser amplitude and frequency noise, atomic projection or number fluctuations, thermal radiation, detector noise, and model mismatch all enter through the data likelihood.
Three different bandwidths
Section titled “Three different bandwidths”The word bandwidth has at least three meanings here.
- Carrier coverage is the set of RF frequencies addressable by available Rydberg transitions or by Stark, Zeeman, or dressing-based tuning. Broad coverage across configurations is not simultaneous broadband reception.
- Instantaneous modulation bandwidth is the highest envelope or phase variation faithfully followed at one carrier setting. It depends on optical pumping, Rabi frequencies, coherence, transit replacement, and detector electronics.
- Measurement bandwidth or resolution bandwidth is the noise-equivalent bandwidth used to turn fluctuations into a spectral sensitivity.
Using for modulation, a first-order response with time constant gives
In a thermal vapor, the transit estimate
can be comparable to or shorter than internal relaxation times. Smaller beams can increase response speed but reduce atom number and interaction length, so bandwidth and sensitivity are jointly engineered.
Lower and upper field limits
Section titled “Lower and upper field limits”At low amplitude, an Autler–Townes estimator fails when the line shape no longer identifies two branches. Line-shape, modulation, or mixer estimators can continue below that point. At high amplitude, the selected pair is no longer isolated: nearby Rydberg levels, multiple RF photons, spatially varying splittings, counter-rotating terms, ionization, and detector scan range can limit the model. A trustworthy dynamic range is the interval over which the chosen response model, identifiability, and uncertainty coverage remain valid. Useful calibrated responses can be nonlinear.
Traceability and Uncertainty
Section titled “Traceability and Uncertainty”The resonant local-field chain is attractive because is exact in the SI and a transition dipole can be calculated from atomic structure:
It is better described as atom-referenced than as automatically self-calibrating. The transition identity, polarization projection, scan-axis scale, RF detuning, and line-shape estimator must still be established. For an external field, one must also fit or invert the cell-transfer model on the field subspace actually identified by the measurements.
For a scalar transfer magnitude and scan factor , the resonant conversion is . Here for the ideal coupling scan and for the ideal counter-propagating probe scan. With independent small uncertainties, a first-order estimate is
denotes a dimensionless relative model uncertainty. Correlations require covariance terms, and line-shape model discrepancy is often not well represented by a single Gaussian contribution. A robust analysis varies beam position and power, reverses or rotates polarizations, changes scan direction, fits alternative plausible models, maps the cell electromagnetically, and reports which corrections were measured rather than assumed.
Precision and accuracy answer different questions. Repeated spectra can give a small while an incorrect cell transfer, pathway dipole, or frequency scale biases every result. Conversely, a traceable calibration does not guarantee high sensitivity or communications-ready bandwidth.
Worked Calibration Example
Section titled “Worked Calibration Example”Suppose a coupling-laser scan resolves a resonant splitting
for an isolated pathway with
The local peak field is
For a linearly polarized sinusoid,
If the same atomic gap were read by scanning a probe while a counter-propagating coupling laser remained fixed, the ideal probe-axis separation would instead be
Applying directly would underestimate the field. Finally, if a validated scalar cell model gives , the inferred external peak field is . The local atomic result does not require that last correction; the external result does.
Choosing an Operating Mode
Section titled “Choosing an Operating Mode”| Goal | Useful mode | Main calibration object | Dominant failure mode |
|---|---|---|---|
| absolute local RF amplitude | resonant resolved splitting | , detuning, scan axis | multilevel or inhomogeneous peaks |
| very weak coherent signal | RF homodyne or heterodyne | LO amplitude, phase, transfer gain | reference noise and drift |
| polarization | resolved sublevels and varied axes | angular pathways and optical polarization | rank-deficient reconstruction |
| off-resonant carrier | AC Stark or dressed-state model | dynamic polarizability or Floquet spectrum | quadratic ambiguity and nearby levels |
| low-frequency or DC field | DC Stark shift with bias or electrodes | differential polarizability and screening | wall charge and field inhomogeneity |
| field image | camera or scanned optical volume | spatial kernel and cell map | interpreting pixel size as resolution |
| communication waveform | locked optical readout and mixer | transfer function and linear range | confusing data rate with carrier coverage |
No mode is universally best. Resolved splitting provides a transparent frequency-to-field conversion but has a linewidth-imposed lower boundary. Mixing provides weak-field and phase sensitivity but consumes a reference. Stark sensing accesses detuned or low-frequency fields but is quadratic unless biased. The estimand decides which compromise is appropriate.
An atom-referenced transducer need not offer quantum-enhanced precision. Large dipoles, optical spatial selectivity, and reconfigurable carrier coverage can be valuable without outperforming a resource-matched receiver. Such a comparison needs the same aperture, bandwidth, prior information, reference resources, and estimation loss.
Exercises
Section titled “Exercises”1. Convert a resolved splitting
Section titled “1. Convert a resolved splitting”A coupling-laser scan resolves a resonant splitting of . The effective peak-field dipole is . Find the local peak and RMS fields.
Solution
Using ,
Therefore
For a linear sinusoid,
2. Correct a detuned doublet
Section titled “2. Correct a detuned doublet”An RF-dressed spectrum gives while an independent frequency measurement gives . Find .
Solution
The generalized gap obeys
The common factor cancels, so
Using directly would overestimate the field by .
3. Derive the probe-scan mapping
Section titled “3. Derive the probe-scan mapping”Take counter-propagating beams with signed wave vectors and . The coupling laser is fixed on resonance. Use the velocity-class condition to express the two-photon detuning in terms of the scanned probe detuning.
Solution
The selected velocity is
With ,
Because , a two-photon separation appears on the probe axis as
4. Identify a polarization blind spot
Section titled “4. Identify a polarization blind spot”A prepared state has only a -allowed RF transition relative to the bias axis. What does an Autler–Townes measurement reveal about a purely transverse field?
Solution
A transition couples to the spherical component , parallel to the quantization axis. A purely transverse field has only components, so the chosen transition has in the ideal selection-rule model. The absence of splitting is a polarization blind spot, not evidence that the total electric field vanishes. Additional and pathways, or a rotated quantization axis, are needed for reconstruction.
5. Fisher information from photon counts
Section titled “5. Fisher information from photon counts”At one operating point the mean detected count is over the local linear range. Assuming Poisson counts, find the single-shot Fisher information and its small-field limit.
Solution
For a Poisson mean,
Since ,
At ,
This bound assumes local unbiasedness and . It describes the specified photon likelihood; calibration and technical noise require their own nuisance parameters.
6. Show how a local oscillator restores linear response
Section titled “6. Show how a local oscillator restores linear response”Suppose the optical observable is . Set with . Find the component at .
Solution
Expanding to first order in gives
The intermediate-frequency amplitude is , linear in the weak signal. Its phase is measured relative to the local oscillator.
7. Propagate an external-field uncertainty
Section titled “7. Propagate an external-field uncertainty”A resonant measurement has independent relative standard uncertainties of from splitting, from the scan factor, from the dipole, and from the cell transfer. Ignore model discrepancy. Find the combined relative uncertainty.
Solution
Add the independent relative variances:
The combined standard uncertainty is about , dominated by the cell transfer. Improving the spectral fit alone would have little effect.
8. Spatial averaging of a quadratic response
Section titled “8. Spatial averaging of a quadratic response”Two equally weighted, noninteracting optical regions experience same-phase fields and . Their weak, additive Stark signals are proportional to . If a uniform-field model is fitted, what amplitude does it infer? Assume propagation introduces no additional nonlinearity.
Solution
The mean signal is proportional to
The fitted positive amplitude is therefore , whereas the mean signed field is . For small inhomogeneity the relative bias is . At , the excess is about . The result measures a weighted RMS field in this particular model. Autler–Townes spectra and finite-depth propagation need their own forward average; the same effective-field rule cannot simply be reused.
References
Section titled “References”-
S. M. Bohaichuk et al., “Origins of Rydberg-atom electrometer transient response and its impact on radio-frequency pulse sensing,” Physical Review Applied 18, 034030 (2022).
-
H. Fan et al., “Effect of vapor-cell geometry on Rydberg-atom-based measurements of radio-frequency electric fields,” Physical Review Applied 4, 044015 (2015).
-
C. L. Holloway et al., “Broadband Rydberg atom-based electric-field probe for SI-traceable, self-calibrated measurements,” IEEE Transactions on Antennas and Propagation 62, 6169–6182 (2014).
-
Y.-Y. Jau and T. Carter, “Vapor-cell-based atomic electrometry for detection frequencies below 1 kHz,” Physical Review Applied 13, 054034 (2020).
-
M. Jing et al., “Atomic superheterodyne receiver based on microwave-dressed Rydberg spectroscopy,” Nature Physics 16, 911–915 (2020).
-
S. Kumar, H. Fan, H. Kübler, J. Sheng, and J. P. Shaffer, “Atom-based sensing of weak radio frequency electric fields using homodyne readout,” Scientific Reports 7, 42981 (2017).
-
D. H. Meyer, Z. A. Castillo, K. C. Cox, and P. D. Kunz, “Assessment of Rydberg atoms for wideband electric field sensing,” Journal of Physics B 53, 034001 (2020).
-
N. Schlossberger et al., “Rydberg states of alkali atoms in atomic vapour as SI-traceable field probes and communications receivers,” Nature Reviews Physics 6, 606–620 (2024).
-
N. Schlossberger et al., “Zeeman-resolved Autler–Townes splitting in Rydberg atoms with tunable resonances and a single transition dipole moment,” Physical Review A 109, L021702 (2024).
-
J. A. Sedlacek, A. Schwettmann, H. Kübler, R. Löw, T. Pfau, and J. P. Shaffer, “Microwave electrometry with Rydberg atoms in a vapour cell using bright atomic resonances,” Nature Physics 8, 819–824 (2012).
-
J. A. Sedlacek, A. Schwettmann, H. Kübler, and J. P. Shaffer, “Atom-based vector microwave electrometry using rubidium Rydberg atoms in a vapor cell,” Physical Review Letters 111, 063001 (2013).
-
M. T. Simons, A. H. Haddab, J. A. Gordon, and C. L. Holloway, “A Rydberg atom-based mixer: Measuring the phase of a radio frequency wave,” Applied Physics Letters 114, 114101 (2019).