

Homodyne and Heterodyne Detection
Homodyne detection measures one phase-selected field quadrature by interfering a signal with a strong coherent reference and subtracting two photodetector outputs. Heterodyne detection shifts the reference frequency and extracts two electronic quadratures, or equivalently divides the signal and performs two orthogonal homodyne measurements. The second method returns a complex amplitude in every trial, but the simultaneous readout necessarily contains added noise from an auxiliary mode. The usual ideal receiver prepares that mode in vacuum, giving equal minimum added noise in both quadratures.
These are not merely bright-field versions of photon counting. Direct photodetection is naturally sensitive to normally ordered intensity and arrival events. A phase-sensitive receiver uses the local oscillator to convert a field amplitude into a macroscopic photocurrent. It can therefore measure vacuum fluctuations, squeezing, coherent displacements, and complete quadrature distributions even when the signal itself carries much less than one photon per selected mode on average.
The description below treats calibrated optical outcomes and inference from repeated preparations. Continuous homodyne detection and heterodyne trajectories describe the conditional evolution during continuous observation.
Required background. Quantized Modes defines the field operators, Beam Splitters supplies the two-port transformation, Coherent Light explains the reference field, and Phase-Space Distributions relates quadrature probabilities to optical states.
Quadrature Convention
Section titled “Quadrature Convention”Let denote the annihilation operator of one declared optical mode, with
Use dimensionless canonical quadratures
so that
The quadrature at phase is
Its conjugate is . For the vacuum and every coherent state,
Some literature instead defines , giving vacuum variance . Others divide once more and quote vacuum variance . Decibel squeezing values are unchanged when signal and vacuum use the same normalization, but raw variances and stochastic-record coefficients are not. The convention must therefore travel with every formula and data set.
The Local Oscillator
Section titled “The Local Oscillator”A local oscillator, abbreviated LO, is a coherent field prepared in the mode to which the receiver should be sensitive. Write its complex amplitude as
The magnitude supplies measurement gain and the phase selects the quadrature. Three roles should be kept distinct.
A relational phase reference
Section titled “A relational phase reference”The phase of an isolated optical mode is not measured against an absolute clock at hundreds of terahertz. It is measured relative to another field. A stable LO realizes that reference. Changing its phase rotates the measured axis in optical phase space; losing the shared reference averages phase-sensitive features over .
For a coherent signal , the homodyne mean is
Thus a phase scan traces the projection of the coherent displacement onto a rotating axis. It does not reveal an observer-independent global optical phase.
A mode selector
Section titled “A mode selector”The interference term requires overlap of spatial profile, polarization, spectrum, and temporal envelope. It does not require a nonzero mean field or first-order mutual coherence: vacuum and number states also have measurable quadrature distributions. The LO selects the field operator that contributes to the difference current. Orthogonal components add direct-detection noise or loss but not the desired phase-sensitive signal.
For a continuous output field satisfying
a normalized temporal mode defines
Normalization gives
The effective depends on the LO envelope, optical propagation, detector response, and electronic weighting used to integrate the current. A pulsed experiment that reports “the quadrature of the pulse” is therefore really reporting the quadrature of this selected mode.
If the intended signal mode is and the normalized LO mode is , their complex overlap is
After adjusting the phase, acts as a pure-loss mode-matching efficiency only when the other components selected by the LO are in independent vacuum states. Occupied or correlated orthogonal modes require their own fluctuations. A high photodiode quantum efficiency cannot repair poor mode overlap.
A linear measurement gain
Section titled “A linear measurement gain”Photodiodes measure intensity. Interference with a bright LO produces a term linear in the weak signal field and proportional to . Increasing LO power can raise this optical signal above electronic noise, but only while the photodiodes, transimpedance amplifiers, subtraction stage, and digitizer remain linear.
A stronger LO does not reduce the signal mode’s quantum uncertainty. It amplifies the quadrature and its quantum fluctuations together. Once electronic noise is negligible, further LO power gives no ideal improvement in quadrature signal-to-noise ratio and may instead cause saturation, heating, or imperfectly rejected classical intensity noise.
Balanced Homodyne Detection
Section titled “Balanced Homodyne Detection”The standard receiver combines the signal and LO on a balanced beam splitter, detects both outputs, and subtracts the resulting photocharges or photocurrents.
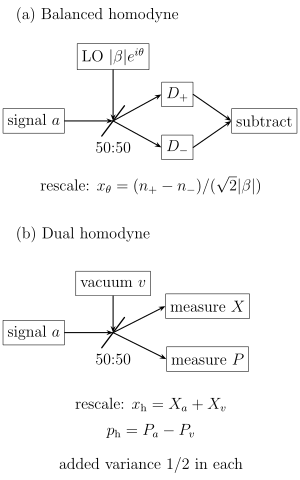
Balanced homodyne detection subtracts two outputs to isolate the quadrature selected by the local oscillator. The equivalent dual-homodyne realization of ideal heterodyne detection exposes the auxiliary vacuum mode: the rescaled outputs and commute and each contain an added variance .
Exact difference operator
Section titled “Exact difference operator”Let be the signal input and the LO input. Choose the balanced-beam-splitter convention
The output number difference is exactly
The individual outputs contain the large LO intensity, whereas that common term cancels in the difference. For an LO coherent state with ,
The normalized number difference therefore approaches
Different beam-splitter phase conventions may replace by or reverse the current sign. Those changes do not alter the measurement; they change the calibrated phase origin.
Why subtraction matters
Section titled “Why subtraction matters”Subtraction has two simultaneous functions:
- It removes the mean LO intensity, leaving the signal–LO interference term.
- It rejects fluctuations common to both photodiode channels.
The second statement is conditional. If the optical splitting ratio, detector responsivities, electronic gains, or time delays differ, LO intensity noise leaks into the difference channel. The residual is often negligible near the shot-noise band and severe at low Fourier frequency. “Balanced” is therefore an experimentally verified operating condition, not merely the presence of two detectors.
The sum channel is also useful:
For a weak signal it monitors LO power and can reveal clipping, power drift, or photodiode mismatch. Normalizing every sample by a noisy instantaneous sum, however, changes the estimator and must be justified rather than applied automatically.
The strong-LO approximation
Section titled “The strong-LO approximation”Write the LO operator as a displacement plus fluctuations,
Then
The first term scales as ; the remaining operator is finite as the LO is increased. In the strong-LO limit, the rescaled output statistics converge to the signal quadrature distribution. At finite LO power, the exact two-mode photodetection model should be retained when the signal is not weak relative to the LO or when high-order moments are required.
Treating as a number does not mean the LO is noiseless. The limiting quadrature distribution already contains the appropriate quantum fluctuations, and photodetection of the bright coherent reference produces shot noise. For an independent coherent LO, the exact normalized variance is . The correction must be small relative to the quadrature variance of interest, which can be far below vacuum; see Squeezed Light.
Measuring Quadratures
Section titled “Measuring Quadratures”An ideal homodyne measurement at phase has the projection-valued measure
where
For a signal state , the outcome density is
It is normalized:
The detector returns samples from , not merely its mean and variance. Histograms can expose non-Gaussian structure that a noise-power measurement misses.
Vacuum
Section titled “Vacuum”In the present convention,
with
Vacuum is therefore not represented by a delta function at zero. Its finite width is the shot-noise reference against which optical squeezing is quoted.
Coherent state
Section titled “Coherent state”For , define its projected mean
The outcome density is
The phase-dependent mean moves, while the variance remains . A coherent state is therefore displaced vacuum in homodyne statistics.
Photon-number state
Section titled “Photon-number state”For a number state ,
where is a Hermite polynomial. The distribution is independent of because a number state is invariant under phase rotation up to a global phase. For it vanishes at and has two lobes, a feature that cannot be inferred from variance alone.
Squeezed Gaussian state
Section titled “Squeezed Gaussian state”Let denote the principal squeezed-axis angle, and let be the squeeze parameter. A pure squeezed vacuum has
At , the variance is ; at the orthogonal phase it is . The uncertainty area is preserved even though one marginal is narrower than vacuum. Squeezed Light develops the generation and interpretation of these states.
Moments from samples
Section titled “Moments from samples”At fixed phase, ideal samples estimate symmetrically ordered quadrature moments:
Finite-sample uncertainty grows rapidly with , especially for states with long tails. High-order moment estimates are also sensitive to digitizer clipping and incorrect electronic-baseline subtraction. Preserving the raw time series and detector metadata is usually more valuable than retaining only a processed variance.
Calibration and Nonidealities
Section titled “Calibration and Nonidealities”An ideal quadrature POVM is a limiting description of an optical receiver. Real voltage samples must first be mapped to dimensionless . That map should be established with independent calibration data, not adjusted until a desired state appears.
Vacuum and shot-noise calibration
Section titled “Vacuum and shot-noise calibration”Replace the signal by vacuum while leaving the LO path, detector settings, filtering, and digitizer range unchanged. If a measured voltage sample is
then the optical gain converts dimensionless quadrature into volts and represents additive electronic noise. With independent, zero-mean terms,
Because , the optical vacuum contribution is proportional to LO power . A useful receiver characterization measures the difference-noise variance over a range of LO powers and tests
Here . The linear term is the expected shot-noise scaling. The constant intercept is electronic noise. A significant quadratic term often indicates leaked LO relative-intensity noise, although other nonlinearities can mimic it. At high power, compression can bend the curve downward. The operating interval should be chosen where the detector is linear, shot noise dominates the electronics, and classical excess noise remains rejected.
Blocking the LO as well as the signal measures electronics; it does not measure optical vacuum noise. Blocking or extinguishing the signal while retaining the LO leaves the signal input in vacuum and supplies the proper optical reference.
There are two common reporting conventions:
- normalize raw variances to the raw vacuum trace, leaving electronic noise in both numerator and denominator;
- estimate the electronic contribution with the LO off, subtract it from both variances, and normalize to the inferred optical shot noise.
The first is conservative but can hide modest squeezing by pulling ratios toward one. The second can overstate squeezing when two large, uncertain numbers are subtracted. A mature analysis reports the convention, clearance, uncertainty, and raw calibration data. Modeling electronics in the detector likelihood is preferable when tomography is the goal.
Loss and mode mismatch
Section titled “Loss and mode mismatch”Pure optical loss with total efficiency , unoccupied environmental ports, and no signal–environment correlations mixes the selected mode with vacuum:
Consequently,
The total efficiency can include propagation, optical transmission, photodiode quantum efficiency, and mode overlap:
This factorization is an experimental model, not an identity. Spatially or temporally varying detector response, excess noise in unmatched modes, and frequency-dependent loss can require a multimode treatment.
Loss drives every quadrature variance toward and smooths non-Gaussian features. Algebraically inverting the variance formula is possible when is known, but full loss inversion amplifies statistical and calibration errors and can yield an unphysical reconstructed density operator. It is often clearer to report the state at the detector input and separately infer the source state with an explicit uncertainty model.
Phase uncertainty
Section titled “Phase uncertainty”Suppose the intended LO phase is the squeezed-axis angle , but the actual phase has a zero-mean Gaussian error of variance , independent of the optical state and nearly constant within each selected temporal mode. For a zero-mean state with principal quadrature variances and , the averaged measured variance before loss is
A displaced state additionally has the variance of its phase-dependent conditional mean. Fast phase variation within the mode changes its effective shape and needs a time-dependent receiver model. Even small quasistatic phase noise can matter when : anti-squeezed noise leaks into the nominally squeezed record. A single “phase-lock bandwidth” does not fully specify this effect. The relevant phase-error spectrum must be weighted by the measurement interval and temporal mode.
Slow phase drift broadens a long-run histogram and can imitate a mixed state. Postselecting or rotating samples using an auxiliary phase estimate may be valid, but then that estimator and its uncertainty are part of the measurement model.
Balance, common-mode rejection, and linearity
Section titled “Balance, common-mode rejection, and linearity”A practical balanced receiver needs matched optical powers, photodiode responsivities, electronic gains, delays, and bandwidths. Its common-mode-rejection ratio should be measured at the Fourier frequencies used in the analysis. A large low-frequency specification does not guarantee good rejection across the full detection band.
Important checks include:
- vary LO power and verify linear mean response and linear shot-noise variance;
- inject a known LO amplitude modulation and measure its leakage into the difference channel;
- inspect each photodiode and the difference output for clipping;
- reverse the signal displacement or LO phase and verify the expected sign change;
- record dark electronics, vacuum, and a known coherent displacement with the same filters and digitizer settings;
- confirm that the inferred vacuum variance is stationary across the data run.
Detector saturation can narrow histograms and falsely suggest squeezing. Rare clipping can strongly bias fourth and higher moments while barely changing the variance. A histogram that ends abruptly at the digitizer rails is a hardware warning, not a non-Gaussian quantum feature.
Electronic filtering
Section titled “Electronic filtering”The receiver does not measure an infinitely broad operator. Let the difference current be and let be the normalized electronic weight assigned to one trial. A pulsed outcome has the form
where is fixed by vacuum calibration. The optical LO envelope and jointly define the temporal mode. Orthogonal temporal modes are discarded only if the receiver and integration really reject them.
Electronic high-pass filtering can introduce negative temporal lobes and correlations between adjacent pulse samples. Low-pass filtering can mix neighboring pulses. The same filter must be included when estimating independent sample count, uncertainty, and a tomographic likelihood.
Pulsed and Continuous-Wave Modes
Section titled “Pulsed and Continuous-Wave Modes”The phrase “homodyne quadrature” covers two experimentally distinct measurement geometries.
Pulsed homodyne detection
Section titled “Pulsed homodyne detection”In time-domain pulsed homodyne detection, each LO pulse gates one selected wave-packet mode. The integrated difference charge gives approximately one quadrature sample per pulse. Good mode matching requires overlap in
- transverse spatial profile and wavefront;
- polarization;
- carrier frequency and spectral phase;
- arrival time and temporal envelope.
Pulse-energy fluctuations are common-mode noise only to the degree that the receiver is balanced. If the signal mode is inferred from data, for example by principal-component analysis of time traces, the training and validation sets should be separated to avoid fitting detector noise.
Continuous-wave spectral homodyne detection
Section titled “Continuous-wave spectral homodyne detection”For a continuous-wave LO, one often analyzes the difference current at radio frequency . In a frame rotating at the LO frequency, the positive frequency component has the structure
The analysis therefore couples the upper and lower optical sidebands at . The measured cosine and sine electronic components are quadratures of sideband supermodes selected by the filter and demodulation phase. They should not automatically be interpreted as the quadratures of one infinitely sharp optical-frequency mode.
Spectral squeezing is reported by comparing the current-noise spectral density with the vacuum spectrum under identical LO power and analyzer settings. Resolution bandwidth, video bandwidth, windowing, averaging, and single-sided versus double-sided spectral conventions all affect numerical values.
Heterodyne Detection
Section titled “Heterodyne Detection”Optical heterodyne detection shifts the LO frequency from the signal carrier:
where is an intermediate frequency within the receiver bandwidth. The balanced difference current contains a beat note whose phase rotates at . Electronic demodulation against and , followed by matched low-pass filtering, produces in-phase and quadrature outputs.
With positive-frequency fields proportional to , the LO envelope in the signal frame is . The signal contribution to the beat current therefore has the form
The sine demodulator sign is calibrated accordingly. This signal-only expression omits the image-band operator and is not a complete quantum noise model. Resolved orthogonal demodulation requires a sufficient intermediate frequency relative to the selected envelope bandwidth. The two demodulators extract both components of the rotating field amplitude from the same acquisition interval. This is operationally attractive for unknown phase, spectroscopy, feedback, and complex-envelope estimation.
Equivalent dual-homodyne model
Section titled “Equivalent dual-homodyne model”The quantum noise is clearest in an equivalent eight-port or dual-homodyne model. Split the signal mode on a balanced beam splitter with an independent vacuum mode . Homodyne the quadrature of one output and the quadrature of the other. After rescaling for the splitter loss, the reported observables are
They commute:
The apparatus can therefore return both real numbers in one trial. The price is that each contains a vacuum contribution independent of the signal:
For a coherent signal, each heterodyne quadrature has variance , compared with variance for the selected quadrature in homodyne detection. This factor of two is often called the 3 dB heterodyne penalty. It is a statement about the ideal per-quadrature noise in these conventions, not a universal comparison of every estimation task. Heterodyne acquires both components per trial, whereas homodyne spends that trial on one chosen phase.
Coherent-state POVM
Section titled “Coherent-state POVM”Combine the two real outcomes into
Ideal heterodyne detection realizes the coherent-state POVM
Its outcome density is the Husimi distribution:
The completeness relation
ensures normalization. The states in the POVM are nonorthogonal, so this is not a projective measurement of a hypothetical complex-amplitude operator.
For an input coherent state ,
Equivalently,
Heterodyne moments correspond naturally to antinormal operator ordering. For example,
The extra unit is not a photon created in the signal. It is the coherent-state POVM’s vacuum smoothing and must be removed, with uncertainty, when estimating mean photon number from ideal heterodyne samples.
Image-band vacuum
Section titled “Image-band vacuum”In frequency-offset heterodyne detection, electronic frequencies cannot by themselves distinguish all optical sidebands that beat to the same intermediate frequency. The unoccupied image band contributes vacuum noise. In the dual-homodyne model, the same contribution is the explicit vacuum port . These are two physical descriptions of the same ideal added-noise requirement.
For an independent thermal image band, both added variances exceed vacuum. A coherent image field instead adds a mean beat with vacuum-level variance; a squeezed image field can lower one added variance while raising the other. Correlated signal and image modes also add covariance terms. These cases require the actual two-mode model and generally change the elementary coherent-state POVM.
Practical heterodyne calibration
Section titled “Practical heterodyne calibration”The in-phase and quadrature electronic channels need separate offset, gain, phase, and bandwidth calibration. A nominal demodulator error turns the circular vacuum cloud into an ellipse and correlates the reported components. Digital correction is legitimate when it is obtained from independent calibration and the transform remains well conditioned.
The following should be checked explicitly:
- intermediate-frequency stability and LO phase noise;
- image-band occupancy and optical filter response;
- gain equality and orthogonality of the two demodulation channels;
- alias rejection, sampling rate, digital windows, and low-pass bandwidth;
- electronic and amplifier noise referred to the optical input;
- receiver compression over the full complex-amplitude range.
Equal minimum added noise in both quadratures uses vacuum. Squeezing the auxiliary mode redistributes the noise rather than removing it from both. Electronic noise, thermal image-band occupancy, phase error, and loss are additional imperfections and should not be renamed “the heterodyne penalty.”
Connection to State Tomography
Section titled “Connection to State Tomography”Quadrature receivers become tomographic instruments when their outcomes are collected over an informationally complete set of settings and interpreted with a calibrated detector model.
Homodyne marginals of the Wigner distribution
Section titled “Homodyne marginals of the Wigner distribution”Let be normalized so that
The homodyne density at phase is its marginal along the axis orthogonal to :
This Radon-transform relation is exact for the ideal single-mode measurement. Define the one-dimensional Fourier transform
It samples the two-dimensional Wigner characteristic function along the radial line
This is the Fourier-slice theorem. In principle, phases over provide every radial direction and determine the state. The relation
makes the second half of a scan redundant for an ideal phase reference.
The inverse transform is developed in Phase-Space Distributions. Finite data require regularization or a constrained state fit. In either case, check that the inferred state predicts distributions at phases not used in fitting, and vary the Fock cutoff or assumed state family. Positive semidefiniteness alone cannot diagnose a miscalibrated detector model.
Heterodyne tomography
Section titled “Heterodyne tomography”Ideal heterodyne samples directly estimate . Because the coherent-state POVM is informationally complete, the exact distribution determines . The distribution is nevertheless smoother than the Wigner function. Recovering fine structure or Wigner negativity requires deconvolution or a state-model fit and can be statistically ill conditioned.
Heterodyne tomography is attractive because every trial gives a two-dimensional point without scanning LO phase. Its added vacuum broadens features, so it may require more data than phase-optimized homodyne detection for a particular quadrature property. The correct comparison depends on the target quantity and estimator, not on the data dimension alone.
Phase-Space Distributions develops the , Wigner, and representations, their ordering rules, reconstruction, and loss transformations. This page supplies the practical receiver model that makes their measurement statements operational.
Exercises
Section titled “Exercises”Exercise 1: Electronics calibrated as vacuum loss
Section titled “Exercise 1: Electronics calibrated as vacuum loss”Let , with independent zero-mean Gaussian electronic noise of variance . A receiver uses its total vacuum variance to normalize all records to , without subtracting electronics. Show that the resulting measurement has the same distribution as ideal homodyne after pure loss. What is its effective efficiency?
Solution
The normalized outcome is . Hence
where is an independent Gaussian of variance . This is the quadrature distribution of the pure-loss channel (Appel et al. 2007). Non-Gaussian electronics with the same variance agree only at the level of second moments, not necessarily the complete outcome distribution.
Exercise 2: Coherent-state phase scan
Section titled “Exercise 2: Coherent-state phase scan”Let . Find the mean and variance of a homodyne outcome at phase . At which phases is the mean largest, zero, and most negative?
Solution
The projected mean is
The coherent-state distribution is Gaussian:
Therefore
The mean is largest at modulo , zero at , and most negative at . The variance is independent of phase. A measured phase-dependent coherent-state variance would indicate technical noise, nonlinearity, or a misdefined mode rather than ideal coherent light.
Exercise 3: Number-state variance is not enough
Section titled “Exercise 3: Number-state variance is not enough”Use the ladder operators to show that
Write explicitly. Why does measuring only the variance fail to establish the one-photon state?
Solution
Phase rotation does not change a number state, so it is enough to use :
The first two terms have zero diagonal matrix element in , while
Hence , and . For , , so
Its node at the origin and two-lobed shape contain information absent from the variance. A thermal or other mixed state can have variance without having this distribution. Full histograms over adequate phases are needed for state identification.
Exercise 4: Loss-degraded squeezing
Section titled “Exercise 4: Loss-degraded squeezing”A source quadrature is below vacuum, using
The total efficiency is . Find the detected variance and detected squeezing in decibels.
Solution
The source variance is
After loss,
Relative to the detected vacuum reference,
The missing squeezing has not become electronic noise. Vacuum coupled through loss has moved the measured variance toward .
Exercise 5: Phase jitter and anti-squeezing
Section titled “Exercise 5: Phase jitter and anti-squeezing”A zero-mean pure Gaussian state has principal variances and . The LO has independent, modewise constant Gaussian phase jitter with standard deviation , and the optical efficiency is . Find the variance observed at the nominal squeezed phase and express it relative to vacuum in decibels.
Solution
Convert the phase error to radians:
Before loss, phase averaging gives
Loss then gives
Thus
The example shows why phase jitter and optical loss should be modeled separately. The jitter mixes in the large anti-squeezed variance before loss pulls the result toward vacuum.
Exercise 6: Squeezing the auxiliary port
Section titled “Exercise 6: Squeezing the auxiliary port”Keep the dual-homodyne observables above, but prepare the independent auxiliary mode in squeezed vacuum with and . Find the two added variances and their product. Can both reported variances approach ideal homodyne variances?
Solution
The commutator still cancels because it depends on operator algebra, not the auxiliary state. The added variances are and , with product . As grows, X readout approaches the homodyne limit while P noise diverges. This is an anisotropic Gaussian joint measurement, rather than the vacuum-seeded Husimi-Q POVM.
Exercise 7: A heterodyne photon-number estimator
Section titled “Exercise 7: A heterodyne photon-number estimator”For a coherent input , ideal heterodyne outcomes obey
Show that
and construct an unbiased estimator of the mean photon number from independent outcomes. What is its variance for vacuum?
Solution
Write , where the circular complex Gaussian variable has
Then
Since a coherent state has , an unbiased ideal estimator is
For vacuum, has an exponential distribution of mean and variance . Independent averaging therefore gives
Loss and electronic noise modify this result and must be included before using the estimator on laboratory data.
Exercise 8: Two indistinguishable pairs of marginals
Section titled “Exercise 8: Two indistinguishable pairs of marginals”Consider zero-mean Gaussian states with covariance matrices
Check that both are physical. Show that X and P homodyne data cannot distinguish them, but a third phase can.
Solution
Each matrix is positive with determinant , so it obeys the one-mode uncertainty condition. Both X and P marginals are centered Gaussians of variance one. At the variances are , namely and . Three suitably chosen phases determine a general one-mode Gaussian covariance; arbitrary non-Gaussian states need a sufficiently complete phase scan and more than second moments.
References
Section titled “References”- J. Appel, D. Hoffman, E. Figueroa, and A. I. Lvovsky, “Electronic noise in optical homodyne tomography,” Physical Review A 75, 035802 (2007).
- E. Arthurs and J. L. Kelly Jr., “On the simultaneous measurement of a pair of conjugate observables,” Bell System Technical Journal 44, 725–729 (1965).
- H.-A. Bachor and T. C. Ralph, A Guide to Experiments in Quantum Optics, 3rd ed. (Wiley-VCH, 2019).
- M. J. Collett, R. Loudon, and C. W. Gardiner, “Quantum theory of optical homodyne and heterodyne detection,” Journal of Modern Optics 34, 881–902 (1987).
- C. W. Gardiner and P. Zoller, Quantum Noise, 3rd ed. (Springer, 2004).
- H. Hansen, T. Aichele, C. Hettich, P. Lodahl, A. I. Lvovsky, J. Mlynek, and S. Schiller, “Ultrasensitive pulsed, balanced homodyne detector: application to time-domain quantum measurements,” Optics Letters 26, 1714–1716 (2001).
- Z. Hradil, J. Řeháček, J. Fiurášek, and M. Ježek, “Maximum-likelihood methods in quantum mechanics,” in M. G. A. Paris and J. Řeháček, eds., Quantum State Estimation, Lecture Notes in Physics 649 (Springer, 2004).
- U. Leonhardt, Measuring the Quantum State of Light (Cambridge University Press, 1997).
- U. Leonhardt, M. Munroe, T. Kiss, Th. Richter, and M. G. Raymer, “Sampling of photon statistics and density matrix using homodyne detection,” Optics Communications 127, 144–160 (1996).
- A. I. Lvovsky and M. G. Raymer, “Continuous-variable optical quantum-state tomography,” Reviews of Modern Physics 81, 299–332 (2009).
- L. Mandel and E. Wolf, Optical Coherence and Quantum Optics (Cambridge University Press, 1995).
- M. G. Raymer and M. Beck, “Experimental quantum state tomography of optical fields and ultrafast statistical sampling,” in Quantum State Estimation, Lecture Notes in Physics 649 (Springer, 2004).
- D. T. Smithey, M. Beck, M. G. Raymer, and A. Faridani, “Measurement of the Wigner distribution and the density matrix of a light mode using optical homodyne tomography: Application to squeezed states and the vacuum,” Physical Review Letters 70, 1244–1247 (1993).
- K. Vogel and H. Risken, “Determination of quasiprobability distributions in terms of probability distributions for the rotated quadrature phase,” Physical Review A 40, 2847–2849 (1989).
- H. P. Yuen and J. H. Shapiro, “Optical communication with two-photon coherent states. Part III: Quantum measurements realizable with photoemissive detectors,” IEEE Transactions on Information Theory 26, 78–92 (1980).