

Hanbury Brown–Twiss Interferometry
A Hanbury Brown–Twiss (HBT) experiment measures correlations between intensity records from two detection channels. In a laboratory arrangement, one optical field is usually divided between two detectors and the delay between their events is histogrammed. In astronomical intensity interferometry, two separated collectors observe the same distant source and their intensity fluctuations are correlated electronically.
Both geometries probe second-order coherence. For a stationary field, the central observable is
Thermal or chaotic light produces excess coincidences over a coherence time: one resolved scalar chaotic field has . Coherent light has , while a suitable single-photon source can show a deficit near zero delay. The apparatus is therefore a correlation instrument, not a device tied to one source class.
The delay convention, accepted modes, counting rule, and timing response determine what a measured peak or dip means.
Required background. Correlation Functions defines the ordered field moments, Photon Counting describes the detector response, Thermal Light explains chaotic-field statistics, and Beam Splitters supplies the two-port transformation used below.
Two Experimental Geometries
Section titled “Two Experimental Geometries”Split-field HBT
Section titled “Split-field HBT”Select the optical modes, split them between two independent detectors, and correlate their time tags or currents as a function of relative delay.
A nonpolarizing beam splitter is convenient, but it is not the defining ingredient. A source can illuminate two detector areas directly, or a polarization splitter can route two selected polarizations. What matters is that the channels sample declared field components and produce records whose joint statistics can be compared.
Separated-collector HBT
Section titled “Separated-collector HBT”In spatial intensity interferometry, collectors at positions and observe one distant source. The projected baseline is
Each site detects locally. The optical fields need not be physically combined; time-stamped or digitized intensity records can be brought together later. The geometric propagation delay must still be modeled and removed before the same source time is compared.
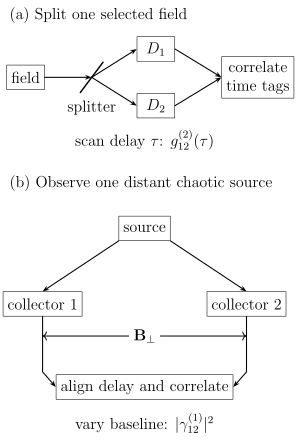
Laboratory HBT estimates a delay-dependent from two detector records. Spatial intensity interferometry instead varies the projected baseline and measures the squared first-order coherence of a chaotic source after compensating geometric delay.
Detector reference planes
Section titled “Detector reference planes”Every channel should be defined at an optical reference plane before detector loss and electronics. A useful declaration is
where denotes polarization selection and a normalized accepted mode or mode family. Without this declaration, a reduced bunching contrast could come from source statistics, spatial separation, polarization averaging, spectral averaging, or detector response.
Why two detectors?
Section titled “Why two detectors?”Two channels turn a same-detector autocorrelation into a cross-correlation. This has practical advantages:
- one detector’s recovery dip does not automatically become a zero-delay anticorrelation in both records;
- independent dark counts contribute an approximately flat accidental baseline;
- channel-specific gains and rates can be monitored separately;
- electrical cross-talk and shared-clock artifacts can be tested with blocked inputs and time shifts.
Two detectors do not remove all artifacts. Optical leakage, electronic cross-talk, common power-supply noise, synchronized gating, or correlated background can still create a false feature.
Amplitude and intensity interferometry
Section titled “Amplitude and intensity interferometry”| Feature | Amplitude | HBT intensity |
|---|---|---|
| primary observable | complex first-order coherence | second-order intensity correlation |
| optical fields | combined before detection | may be detected independently |
| phase information | retains a relative optical phase | standard two-channel form returns for chaotic light |
| path control | optical-phase stability is central | geometric delay and electronic timing remain central |
| sensitivity | usually higher for a given optical flux | pays a correlation-statistics penalty |
| common output | fringe visibility and phase | coincidence excess or current covariance |
Intensity interferometry is often more tolerant of optical phase disturbance, but “phase insensitive” does not mean calibration insensitive. Baseline geometry, timing, spectral response, polarization, and detector correlations remain part of the measurement.
The Operational Observable
Section titled “The Operational Observable”Normally ordered joint detection
Section titled “Normally ordered joint detection”For stationary scalar fields at two detector channels,
The normalized function is
Normal ordering is the photodetection ordering. For independent output channels, the field operators commute between channels and the product is already normally ordered. The distinction is crucial for a same-mode moment: excludes self-pairing, whereas includes it.
Current-fluctuation form
Section titled “Current-fluctuation form”Analog detectors and radio-frequency implementations often correlate photocurrent fluctuations. Define
and
For linear detectors, negligible cross-talk, and response much faster than the field feature,
The proportionality becomes a calibrated equality only after detector gains, bandwidths, and impulse responses are specified. A digital coincidence histogram and an analog current correlator estimate the same field structure in appropriate limits, but they are not identical raw data products.
Conditional-rate interpretation
Section titled “Conditional-rate interpretation”Let be the steady rate in channel 2. In an ideal stationary time-tag experiment,
is the channel-2 event rate conditioned on a channel-1 event at time zero. Thus:
- means an enhanced conditional rate;
- means the tested event rate equals its steady baseline;
- means a suppressed conditional rate.
This is a statement about an ensemble of records. It does not assign a force between individual photons.
What the Beam Splitter Does
Section titled “What the Beam Splitter Does”Let be the accepted source mode and the unused vacuum input. For one lossless convention,
with . Vacuum in the unused port and normal ordering give
The cross-channel factorial moment is
Consequently,
whenever the denominator is nonzero and the ideal assumptions apply. The splitter routes incident fluctuations to two channels; it does not create the thermal bunching.
The same cancellation holds at nonzero delay for a stationary field when both outputs select the same incident mode family. Unequal filters, polarization projections, nonlinear threshold response, saturation, or correlated background invalidate the simple cancellation.
Thermal Bunching
Section titled “Thermal Bunching”The Siegert relation in an HBT measurement
Section titled “The Siegert relation in an HBT measurement”For a zero-mean circular complex Gaussian field,
This is the Siegert relation. It connects the measured excess coincidence probability to first-order mutual coherence:
At one point, one time, and for one resolved scalar thermal mode,
For a traveling field with decaying first-order coherence, at delays much longer than that coherence time,
An isolated single-frequency thermal oscillator instead has constant and no finite decorrelation time. The Siegert relation requires zero-mean circular Gaussian statistics in the selected scalar channels. A noisy laser, intermittent source, blinking emitter, nonlinear detector, or non-Gaussian field can have without obeying the Siegert relation.
A temporal line-shape example
Section titled “A temporal line-shape example”Suppose a stationary chaotic field has
Then
Here is the angular-frequency Lorentzian HWHM, with for the full-real-line detuning approximation. The bunching excess has area
Peak height and correlation area answer different questions. Timing blur can reduce the observed height while leaving the ideal convolution area unchanged.
Conditional intuition
Section titled “Conditional intuition”Chaotic light has fluctuating complex amplitude. An event is more likely when the instantaneous intensity is above average. Conditioning on one event therefore biases the nearby record toward an interval of elevated intensity, and the second event rate is enhanced until the field loses memory.
This language does not imply that an individual count reveals a pre-existing classical intensity in every quantum state. It is an exact intuition for classical Gaussian fields and a useful record-level interpretation of the thermal quantum state.
More than one detected mode
Section titled “More than one detected mode”If the detector sums occupations of independent thermal modes with means , and the splitter/detector weights are proportional in both channels, then
Define
Then
This is an incoherent mode sum, not a coherent projection onto one superposed scalar mode. Orthogonal polarizations can be summed directly; temporal or spectral mode counts describe a finite detection gate. Instantaneous sampling of a broadband scalar Gaussian field still has ; finite timing resolution is a separate averaging effect. For two equally weighted independent polarizations, and the ideal unresolved value is , not .
Bunching is not a nonclassicality witness
Section titled “Bunching is not a nonclassicality witness”Thermal bunching has a complete classical stochastic-wave account. It is a landmark of higher-order coherence and quantum photodetection, but is not by itself evidence of nonclassical light. A positive Glauber–Sudarshan representation can reproduce it.
The nonclassical statement associated with the following page is different: a stationary classical field under the standard assumptions cannot have a zero-delay value below nearby delayed values. The apparatus may be similar; the inference is not.
Building a Coincidence Histogram
Section titled “Building a Coincidence Histogram”Raw time tags
Section titled “Raw time tags”Let channel 1 record times and channel 2 record times . For a lag bin centered at with width , define
where is one when its argument lies in the selected bin and zero otherwise. This definition makes three choices visible:
- which channel starts the delay;
- whether every eligible pair or only a start–stop partner is counted;
- the exact bin edges.
All-pairs correlation is symmetric under channel exchange after reversing delay. A first-stop time-to-amplitude converter produces a waiting-time distribution unless low rates and corrections justify identifying it with an all-pairs correlation.
The accidental baseline
Section titled “The accidental baseline”For independent stationary records with constant rates and , the expected accidental pairs in one bin are approximately
Here is the overlap of the two channel live-time windows after one record is shifted by . For uninterrupted acquisition of duration ,
inside the available lag range. The edge correction is negligible only when the plotted delays are small compared with the acquisition duration.
Poisson statistics within each separate stream are not needed for this mean cross-pair baseline: independence between streams is enough. They would affect its sampling uncertainty. An ideal continuous estimator is
Computing from mean rates is appropriate only when the live time, stationarity, and detector response assumptions hold. Time-shifted records, event mixing between comparable acquisition blocks, or explicit exposure calculation often provide a safer baseline.
Large-delay normalization
Section titled “Large-delay normalization”If the source is stationary and all physical correlations have decayed, one may normalize by the mean histogram level in a declared far-delay region:
This method fails when the selected region contains:
- slow source fluctuations or blinking;
- periodic drive structure;
- afterpulsing or detector recovery;
- clock sidebands or electronic ringing;
- a broad physical correlation tail;
- changing exposure with delay.
The normalization window is part of the result and should be reported.
Pulsed sources
Section titled “Pulsed sources”For a source repeated every , the delay histogram often has peaks near
Let be the integrated area of the th peak using identical windows. A common estimator is
where is a declared set of nonzero side peaks. The estimator assumes that different pulses are independent, identically prepared, and sampled with the same exposure. It also requires linear count products, or threshold click probabilities low enough that the relevant higher factorial moments are negligible. Pulse-to-pulse drift, blinking, detector recovery, unequal gates, or a modulated envelope can bias the side-peak baseline.
For threshold detectors the exact pulse ratio is instead a click ratio. Write , , and , with , vacuum in the unused port, and no dark counts. Then
Independent side pulses give , so the peak-area ratio approaches . Only in the controlled weak-response limit does this become . Neither pulse ratio is automatically an infinitesimal continuous-time correlation.
Uncertainty
Section titled “Uncertainty”A histogram bin is not always an independent Poisson variable. One event can contribute to several lag bins, normalization parameters are estimated from the same record, and source drift couples distant delays. Useful uncertainty methods include:
- a likelihood that models the time-tag process and detector response;
- block bootstrap resampling longer than source and detector memory;
- independent acquisition segments with between-segment scatter;
- propagation of rate, background, timing, and baseline calibration uncertainty.
A smooth fitted curve does not replace residual checks or an uncertainty model for the raw counts.
Instrument Response
Section titled “Instrument Response”Linear efficiency cancels from normalized correlation
Section titled “Linear efficiency cancels from normalized correlation”For nonzero, mode-independent linear efficiencies and ,
and
Therefore the efficiencies cancel in ideal normalized . This invariance does not make efficiency irrelevant. Lower efficiency reduces the number of useful pairs and worsens precision. It also changes the signal fraction relative to fixed dark or background rates.
The cancellation fails for saturation, threshold pileup, state-dependent efficiency, detector memory, or postselection that acts differently on the numerator and denominator.
Independent background dilutes the excess
Section titled “Independent background dilutes the excess”Let channel contain signal rate and independent Poisson background rate , added as noninterfering counts and independent of both signal records. Define the signal fraction
If the signal has correlation , then
For equal channels this becomes the familiar squared signal-fraction correction. A background-corrected peak inherits uncertainty from all four rates and from the assumption that the backgrounds are independent and Poissonian. Same-mode coherent leakage can interfere with the signal field and is not described by this additive-count formula.
Correlated stray light, electronic pickup, fluorescence, or clock feedthrough does not obey this formula. Such backgrounds can create a peak rather than merely dilute one.
Timing response convolves the feature
Section titled “Timing response convolves the feature”Let be the normalized relative timing-response density of the two channels, including detector jitter and analysis binning. Then the measured excess is approximately
where
If is normalized and the integration range is complete,
Thus poor resolution can make a genuine thermal peak shallow while preserving its correlation area. The statement assumes a linear stationary response and no clipping of the fitted delay range.
Timing jitter, timestamp quantization, synchronization drift, and histogram bin width are distinct. A fine digital bin does not undo broad physical jitter.
Dead time, afterpulsing, and cross-talk
Section titled “Dead time, afterpulsing, and cross-talk”Dead time removes events following a detection. In a same-detector autocorrelation it can manufacture a zero-delay dip. A two-detector cross-correlation suppresses that particular artifact, but several effects remain:
- saturation or shared acquisition dead time can couple both channels;
- afterpulses can produce delayed shoulders or peaks;
- optical or electronic cross-talk can produce a narrow zero-delay excess;
- periodic gating and clock leakage can produce a comb;
- pileup can make the response rate dependent.
Blocked-input runs, independent light sources, cable-delay changes, detector swaps, rate scans, and time-shift tests help separate an optical feature from an instrumental one.
Optical bandwidth and timing bandwidth
Section titled “Optical bandwidth and timing bandwidth”For chaotic light, narrower optical bandwidth generally lengthens the coherence time and makes a bunching feature easier to resolve. It also reduces the photon rate. For a smooth source spectrum, the photon rate per detected mode decreases roughly in the same proportion that the coherence time increases. Narrow filtering therefore does not provide unlimited signal-to-noise improvement.
The relevant comparison is among:
- optical coherence time;
- detector relative jitter;
- electronic correlation bandwidth;
- histogram bin width;
- source and detector memory times;
- total integration time.
Filtering can still be valuable because it isolates one spectral feature, reduces background, controls modal averaging, and brings the optical correlation within the detector’s timing resolution.
Polarization and mode matching
Section titled “Polarization and mode matching”The two channels need not accept exactly the same polarization or spatial mode. For vector fields, the HBT numerator contains the relevant polarization projections of the coherence matrix. Orthogonal, statistically independent polarizations have no mutual bunching excess. Partial overlap gives an intermediate value.
A useful calibration varies the analyzer angle or spatial overlap. A peak that does not follow the predicted optical projection may be technical intensity noise or electronic cross-talk.
Spatial Intensity Interferometry
Section titled “Spatial Intensity Interferometry”Geometric delay
Section titled “Geometric delay”For baseline and source direction , one common geometric-delay convention is
The sign depends on which detector defines positive delay. A spatial HBT analysis correlates after applying the declared geometric delay, clock offsets, cable delays, and detector latency. Earth rotation changes both the projected baseline and the delay during a stellar observation.
From bunching to mutual coherence
Section titled “From bunching to mutual coherence”For quasi-monochromatic, spatially incoherent, Gaussian chaotic radiation, the equal-source-time Siegert relation gives
The quantity is the normalized mutual coherence of the field at the two collectors. The experiment therefore measures a squared visibility even though no optical fringe is formed between the collectors.
Finite timing resolution, unresolved polarization, optical bandwidth, and other accepted modes multiply or average the ideal contrast. A practical fit often has the form
where is a calibrated contrast factor. It is not legitimate to set merely because the source is thermal.
The van Cittert–Zernike relation
Section titled “The van Cittert–Zernike relation”Let be the angular brightness distribution of a distant, spatially incoherent source over small sky angle . Define the dimensionless spatial frequency
The far-field coherence is the normalized Fourier transform
with
This is the van Cittert–Zernike relation under its usual far-field, quasi-monochromatic, and spatial-incoherence assumptions. The Fourier convention and projected baseline must be stated together.
Fourier Transform develops the transform independently of this optical application.
Uniform circular disk
Section titled “Uniform circular disk”For a uniformly bright circular disk of angular diameter ,
where
The measured baseline curve is
The first zero of is near , so
This estimate exposes the angular-resolution scale. A real star is not usually a uniform disk: limb darkening, rotation, companions, winds, spectral lines, and wavelength-dependent photospheric structure alter the visibility curve. Bessel Functions gives the mathematical properties of .
Broadband and projected-baseline fitting
Section titled “Broadband and projected-baseline fitting”A trustworthy angular-diameter fit forward models:
- the time-dependent projected baseline in the sky plane;
- the geometric delay and clock calibration;
- the full spectral transmission and detector response;
- polarization and modal contrast;
- the stellar brightness model, including limb darkening when relevant;
- zero-baseline or reference-source calibration;
- correlated uncertainty between delay and baseline bins.
Broadband averaging must include the timing response. With detected cross-spectral density in the convention
the ideal excess is , and the measured zero-delay excess convolves that entire function with . One generally cannot square each frequency’s coherence before summing. If the timing kernel is nearly constant over the complete correlation feature, Parseval’s relation instead gives
It is in this unresolved-coherence limit, or with independently resolved spectral channels, that a spectral average of squared visibility is useful. Its weights include spectral flux and both detector responses. Even then, one effective wavelength and a baseline-independent contrast factor need checking against the actual bandpass.
What information is lost?
Section titled “What information is lost?”Standard two-detector HBT measures
not the complex phase of . Consequently, source translation multiplies the Fourier transform by a phase but leaves the measured quantity unchanged. Mirror-related or otherwise phase-ambiguous brightness distributions can also share the same squared visibility.
An angular diameter can be inferred by fitting a constrained source model. General image reconstruction is a phase-retrieval problem and needs broad baseline coverage, priors, or higher-order information. A two-detector baseline curve alone is not a unique image.
Classical Wave Interpretation
Section titled “Classical Wave Interpretation”Let and be zero-mean circular complex Gaussian field amplitudes. The detected intensities are
Gaussian moment factorization gives
After normalization,
The interpretation is intensity fluctuation correlation. Two detectors sample the same random wave pattern to the extent quantified by mutual coherence. When one channel sees an above-average fluctuation, the other is more likely to do so as well.
This derivation explains why thermal HBT bunching does not require photon interactions and is not uniquely quantum. It also displays the assumptions: zero mean, Gaussian statistics, linear intensity detection, and the chosen mode projections.
Quantum Photodetection Interpretation
Section titled “Quantum Photodetection Interpretation”Quantum theory assigns the coincidence rate to the normally ordered expectation
For chaotic radiation from many independent source elements, two detections can arise through alternatives that exchange which source contribution reaches which detector. When those alternatives are indistinguishable, their amplitudes interfere. For this zero-mean circular Gaussian state, the exchange term is , reproducing the Gaussian-wave result. Bosonic statistics alone do not force positive bunching for every prepared state; Fock states and single-emitter fields provide counterexamples.
The operator account is more general than the classical one:
- it defines direct detection for states without a positive classical probability representation;
- it distinguishes normal, symmetric, and time ordering;
- it predicts coherent, thermal, Fock, squeezed, and emitter-field correlations in one framework;
- it connects the measured record to a density operator and detector POVM.
For thermal Gaussian light, the classical and quantum predictions agree. Calling one description “the real cause” adds no experimentally testable content within their shared domain.
Not evidence that photons attract
Section titled “Not evidence that photons attract”Bunching does not mean that photons exert an attractive force. The field propagates linearly in the ideal HBT experiment. The excess is a correlation of a prepared state and selected modes, revealed by joint detection.
Likewise, the phrase “photon arrival time” is shorthand for a detector event time. Propagation, absorption, carrier generation, thresholding, and timestamp assignment lie between the field and the stored record.
Historical Arc
Section titled “Historical Arc”Hanbury Brown and Twiss first developed intensity interferometry for radio astronomy. Their 1954 instrument correlated independently detected intensity fluctuations rather than preserving radio-frequency phase across the baseline.
In 1956 they reported an optical laboratory experiment in which light from one source was divided between two photodetectors and the output fluctuations were correlated. The title’s phrase “coherent beams” used the coherence language of that period; it should not be read as a claim that the source was an ideal Glauber coherent state.
Later in 1956 they tested a separated-collector optical intensity interferometer on Sirius. A detailed series in the Proceedings of the Royal Society A developed the theory, laboratory tests, astronomical application, and Sirius measurement. The later Narrabri Stellar Intensity Interferometer reported angular diameters for 32 stars.
Glauber’s 1963 photodetection theory placed these measurements within the normally ordered hierarchy of optical coherence. HBT methods now span astronomy, laboratory quantum optics, source characterization, and correlations of other identical particles, although those extensions require their own source and detector models.
Exercises
Section titled “Exercises”1. The splitter does not change normalized bunching
Section titled “1. The splitter does not change normalized bunching”A source mode enters a lossless splitter with vacuum in the other input. The outputs have power fractions and . Show that the cross-channel zero-delay correlation equals the source correlation.
Solution
With vacuum in the unused port, normally ordered moments containing a nontrivial vacuum operator vanish. The mean output occupations are
The coincidence numerator is
Therefore
The routing factors cancel. The equality assumes linear detection, a vacuum unused input, nonzero , and nonzero mean source intensity.
2. Bunching diluted by a finite delay bin
Section titled “2. Bunching diluted by a finite delay bin”An ideal chaotic field has
A histogram reports the average over a top-hat zero-delay bin of width . Find the reported value and its limits for and .
Solution
The averaged excess is
Using symmetry,
Hence
For a well-resolved peak,
For a bin much wider than the coherence time,
The source remains chaotic in one spatial/polarization channel even though the observed peak tends toward one as the bin widens; its frequency continuum has not become a single monochromatic oscillator.
3. Unequally weighted thermal modes
Section titled “3. Unequally weighted thermal modes”The detector sums the intensities of three independent, mutually orthogonal thermal channels with rates in the ratio . Both HBT branches weight them proportionally. Find and the zero-delay HBT value.
Solution
The effective mode number is
Therefore
The value is about . Counting modes without their weights would give the wrong contrast.
4. Asymmetric background dilution
Section titled “4. Asymmetric background dilution”An ideal thermal signal has . Channel 1 has signal and background rates
while channel 2 has
Assuming independent Poisson backgrounds, predict the raw zero-delay value.
Solution
The signal fractions are
and
The observed excess is
Thus
A raw value below two is expected even before timing blur or multimode averaging.
5. Continuous-time accidental normalization
Section titled “5. Continuous-time accidental normalization”Two stationary channels have rates
They are recorded for with no gaps. A central lag bin has width and contains 150 pairs. Estimate its accidental baseline and normalized correlation. Neglect edge effects.
Solution
The independent-record baseline is
The normalized estimate is
A naive counting-only standard error would be approximately
but a complete uncertainty includes the estimated rates, baseline exposure, shared-event covariance, and any background or timing correction.
6. Angular diameter from the first visibility zero
Section titled “6. Angular diameter from the first visibility zero”At wavelength , a uniform-disk fit places the first zero of the HBT baseline curve at . Estimate the angular diameter in radians and milliarcseconds.
Solution
For a uniform disk,
Substitution gives
Using
one obtains
This is a uniform-disk diameter. A limb-darkened diameter requires an additional source model and bandpass treatment.
7. Why standard two-detector HBT loses source position
Section titled “7. Why standard two-detector HBT loses source position”Let a sky brightness distribution be translated by :
Show that the standard HBT baseline observable is unchanged.
Solution
Apply the shift theorem to the source Fourier transform:
Normalization at is unchanged, so
Taking the squared modulus removes the translation phase:
Standard two-detector HBT therefore cannot determine an absolute image centroid from squared visibility alone. This is one concrete form of the phase-retrieval ambiguity.
8. Derive thermal bunching from Gaussian waves
Section titled “8. Derive thermal bunching from Gaussian waves”Let and be zero-mean circular complex Gaussian field amplitudes. Use Gaussian moment factorization to derive the two-channel Siegert relation. Explain why the result is not a nonclassicality witness.
Solution
The intensity product is
Gaussian factorization pairs the four amplitudes. Circularity makes the anomalous pairings
vanish. The remaining terms give
Because the last two factors are complex conjugates,
Divide by :
The derivation used a classical random field with a positive probability distribution. Thermal bunching is therefore compatible with classical wave statistics. Quantum photodetection reproduces and generalizes the result, but the inequality alone does not certify nonclassical light.
9. Threshold saturation changes a pulsed HBT ratio
Section titled “9. Threshold saturation changes a pulsed HBT ratio”Send exactly two photons into one port of a balanced splitter with ideal threshold detectors. Find , , and , and compare the central/side-peak ratio with the source factorial correlation. Then include equal small detector efficiency .
Solution
At unit efficiency, the outputs contain with probabilities . Hence , , and the ratio is , rather than the source value . For efficiency in each branch,
The weak-response limit recovers the factorial moment at the cost of fewer coincidences. A click histogram at high efficiency needs its actual POVM, even for a perfectly known source.
References
Section titled “References”- A. U. Abeysekara et al., “Demonstration of Stellar Intensity Interferometry with the Four VERITAS Telescopes,” Nature Astronomy 4, 1164–1169 (2020), doi:10.1038/s41550-020-1143-y.
- G. Baym, “The Physics of Hanbury Brown–Twiss Intensity Interferometry: From Stars to Nuclear Collisions,” Acta Physica Polonica B 29, 1839–1884 (1998), arXiv:nucl-th/9804026.
- P. H. van Cittert, “Die wahrscheinliche Schwingungsverteilung in einer von einer Lichtquelle direkt oder mittels einer Linse beleuchteten Ebene,” Physica 1, 201–210 (1934), doi:10.1016/S0031-8914(34)90026-4.
- R. J. Glauber, “The Quantum Theory of Optical Coherence,” Physical Review 130, 2529–2539 (1963), doi:10.1103/PhysRev.130.2529.
- J. W. Goodman, Statistical Optics, 2nd ed., Wiley (2015).
- R. Hanbury Brown, The Intensity Interferometer: Its Application to Astronomy, Taylor & Francis (1974).
- R. Hanbury Brown, J. Davis, and L. R. Allen, “The Angular Diameters of 32 Stars,” Monthly Notices of the Royal Astronomical Society 167, 121–136 (1974), doi:10.1093/mnras/167.1.121.
- R. Hanbury Brown and R. Q. Twiss, “A New Type of Interferometer for Use in Radio Astronomy,” Philosophical Magazine 45, 663–682 (1954), doi:10.1080/14786440708520475.
- R. Hanbury Brown and R. Q. Twiss, “A Test of a New Type of Stellar Interferometer on Sirius,” Nature 178, 1046–1048 (1956), doi:10.1038/1781046a0.
- R. Hanbury Brown and R. Q. Twiss, “Correlation between Photons in Two Coherent Beams of Light,” Nature 177, 27–29 (1956), doi:10.1038/177027a0.
- R. Hanbury Brown and R. Q. Twiss, “Interferometry of the Intensity Fluctuations in Light. I. Basic Theory: The Correlation between Photons in Coherent Beams of Radiation,” Proceedings of the Royal Society A 242, 300–324 (1957), doi:10.1098/rspa.1957.0177.
- R. Hanbury Brown and R. Q. Twiss, “Interferometry of the Intensity Fluctuations in Light. II. An Experimental Test of the Theory for Partially Coherent Light,” Proceedings of the Royal Society A 243, 291–319 (1958), doi:10.1098/rspa.1958.0001.
- R. Loudon, The Quantum Theory of Light, 3rd ed., Oxford University Press (2000).
- L. Mandel and E. Wolf, Optical Coherence and Quantum Optics, Cambridge University Press (1995), doi:10.1017/CBO9781139644105.
- B. L. Morgan and L. Mandel, “Measurement of Photon Bunching in a Thermal Light Beam,” Physical Review Letters 16, 1012–1015 (1966), doi:10.1103/PhysRevLett.16.1012.
- F. Zernike, “The Concept of Degree of Coherence and Its Application to Optical Problems,” Physica 5, 785–795 (1938), doi:10.1016/S0031-8914(38)80203-2.