

Fundamental Constants
Atomic, molecular, and optical experiments do not merely use fundamental constants. They help determine them. Recoil interferometers connect photon momentum to atomic mass, trapped particles compare spin and orbital frequencies in the same magnetic field, and precision spectra compare measured transition frequencies with bound-state quantum electrodynamics (QED). A global adjustment then combines these heterogeneous observations into a self-consistent set of constants and covariances.
This process is an inverse problem, not a cataloguing exercise. A quoted value such as
is the output of the 2022 Committee on Data (CODATA) adjustment. It is not a single direct reading, and the parentheses are not a guarantee that every high-precision input agreed before statistical treatment. In the fine-structure-constant sector, several exceptionally precise inputs remain in tension.
The practical questions are therefore:
- Which quantities are exact by definition, which are adjusted from data, and which are derived?
- What observational equation connects each apparatus to the constants?
- Which theory terms and auxiliary constants enter that equation?
- Which uncertainties are shared, and which correlations survive into the recommended values?
- Does a newer publication update an input datum, or has an international adjustment actually superseded the recommendation?
The answers matter whenever constants are used to test QED, convert between units, interpret spectroscopy, or search for physics beyond the Standard Model.
Helpful background. Precision spectroscopy explains how a spectral signal becomes a corrected frequency. Atomic units derives the scales used below. For numerical lookup use constants; for changes with time or position see variation searches.
Defining and Determining Physical Constants
Section titled “Defining and Determining Physical Constants”Three metrological statuses
Section titled “Three metrological statuses”In the present International System of Units (SI), it is useful to separate three statuses.
| Status | Meaning | AMO examples |
|---|---|---|
| Defining | A stipulated exact numerical value defines a unit; its experimental realization still has uncertainty. | , , , the caesium-133 hyperfine frequency |
| Adjusted | A value and covariance are inferred from an evaluated body of experimental and theoretical input data. | , , , , magnetic-moment ratios |
| Derived | A value follows algebraically from defining and adjusted quantities. | , , , , in SI units |
The categories depend partly on the unit definition. The 2019 SI revision fixed and exactly, while had already been exact since 1983. The vacuum magnetic permeability is no longer exactly . Instead,
Thus an improved value of improves the SI values of both and . The physical content has not changed; the allocation between exact definitions and experimentally inferred numbers has.
Dimensionless and dimensional statements
Section titled “Dimensionless and dimensional statements”The fine-structure constant
and the mass ratio are dimensionless. Their numerical values do not depend on whether one uses SI, Gaussian, atomic, or natural units. Their determination can therefore be compared across unit conventions without conversion.
By contrast, the numerical values of in , in kilograms, or in depend on the unit definitions. These quantities are still physically meaningful and measurable, but statements about a hypothetical change must identify the reference standard. This is why a claim that a dimensional constant alone “varies” is incomplete.
Observation is not the adjusted constant
Section titled “Observation is not the adjusted constant”Let collect measured inputs and the constants to be adjusted. Each datum has an observational equation
where denotes auxiliary quantities and calculated corrections. The symbol emphasizes that this is the equation used for inference, not necessarily a defining identity. Examples include
The last row uses positive frequency magnitudes and . An experimental paper may report , a transition frequency, or a frequency ratio. Calling its converted value “a measurement of ” is convenient, but the conversion also uses , relative masses, electromagnetic theory, and their covariances.
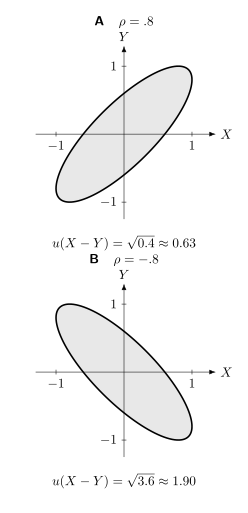
Correlation changes which combination is precise. Both centered Gaussian examples have , yet is much smaller for positive correlation. The curves are constant Mahalanobis-distance contours ; in two dimensions they enclose about 39% of the probability, not a 68% joint confidence region. Marginal error bars alone do not show this geometry.
Correlated Least-Squares Adjustment
Section titled “Correlated Least-Squares Adjustment”Linearization and the normal equations
Section titled “Linearization and the normal equations”Suppose the measured input vector has covariance matrix . Near a reference point , linearize the observational equations:
With
the generalized least-squares estimate minimizes
When the normal matrix is nonsingular,
and, in the linear-Gaussian approximation,
The off-diagonal elements of are part of the result. A later calculation involving two adjusted constants must use
not add the two quoted marginal uncertainties in quadrature while silently setting their correlation to zero.
Why correlations arise
Section titled “Why correlations arise”Correlations enter at several levels:
- Two frequencies may share the same clock, comb, magnetic-field calibration, or line-shape model.
- Several theoretical predictions may share an uncalculated QED coefficient or a nuclear radius.
- One input value may already be a least-squares result with internal covariance.
- The adjustment itself couples constants because one observable depends on several of them.
For example, hydrogen spectroscopy determines a narrow combination of and , so the adjusted values can be strongly correlated even if the raw transition measurements were independent. Ignoring that correlation can make a derived transition prediction look either artificially precise or artificially uncertain.
Residuals, inconsistency, and uncertainty expansion
Section titled “Residuals, inconsistency, and uncertainty expansion”For input , a normalized residual is schematically
The denominator must be specified: dividing by the input uncertainty is not the same as dividing by the residual’s uncertainty. In the linear fit above, the full residual covariance is , because the fitted prediction uses the same data. Large residuals relative to the chosen convention can reveal an inadequate input-uncertainty model.
CODATA may apply a common expansion factor to selected uncertainties before the final adjustment. This is an explicit, documented response to inconsistent data. It does not identify which experiment is biased, erase the disagreement, or convert incompatible results into independent confirmation.
In the 2022 adjustment:
- uncertainties of six leading fine-structure-constant inputs were multiplied by ;
- the unexpanded normalized residual of the 2018 caesium recoil result was about ; and
- uncertainties of selected hydrogen and deuterium transition data were multiplied by because their scatter exceeded the adopted model.
Uncertainty expansion changes the numerical weight of the inputs; it does not explain their disagreement.
Which adjustment is current?
Section titled “Which adjustment is current?”The numerical examples here use CODATA 2022, whose input cutoff was 31 December 2022. NIST still listed this set on 14 October 2026 and announced 31 December 2026 as the cutoff for the next regular adjustment. An edition label identifies the data considered, not necessarily the publication year of the final report.
Newer measurements can be more precise than the current recommendation and can foreshadow a future adjustment. They should be labelled post-CODATA 2022, not silently substituted into a table headed “recommended constants.”
Selected CODATA 2022 values
Section titled “Selected CODATA 2022 values”The following rounded values are useful for discussing the inference network. Use the Constants table or the official NIST database for machine-facing work.
| Quantity | CODATA 2022 value | Relative standard uncertainty |
|---|---|---|
The digits in parentheses are one-standard-deviation uncertainties in the last quoted digits. They are marginal uncertainties; they do not display the correlations among entries.
Fine-Structure Constant
Section titled “Fine-Structure Constant”Physical role and present SI role
Section titled “Physical role and present SI role”The fine-structure constant sets the dimensionless strength of the electromagnetic interaction:
In nonrelativistic atomic physics, it relates characteristic scales:
In QED it is the perturbative expansion parameter, although coefficients, logarithms, bound-state factors such as , and nonperturbative effects determine the accuracy of any particular truncation.
Because , , and are exact in the current SI,
is now an experimentally inferred quantity. Statements that is exact refer to the pre-2019 SI.
Atom-recoil route
Section titled “Atom-recoil route”Combining
with the relative atomic masses
gives the recoil observational equation
An atom interferometer measures the response to known photon momentum. For a two-level momentum separation , the single-photon recoil angular frequency is
Large-momentum-transfer pulses or Bloch oscillations amplify the phase associated with . The final value of also requires and . The method is largely independent of the electron-anomaly route, which makes the comparison especially valuable.
The leading experimental issues include:
- wavefront curvature and Gouy phase, which change the effective photon momentum;
- spatial sampling of the optical field by a finite-temperature cloud;
- gravity gradients, Coriolis acceleration, and trajectory mismatch;
- light shifts, diffraction phases, and pulse imperfections;
- refractive-index corrections from background atoms; and
- atomic-mass and binding-energy inputs.
The sensor-level treatment is developed in Atom-Interferometric Sensors.
Electron magnetic anomaly route
Section titled “Electron magnetic anomaly route”For a free electron,
The Standard Model prediction can be organized as
The include the QED dependence on lepton mass ratios; the final two terms are hadronic and weak contributions. Mass-ratio terms must not be added again if they are already included in the . A Penning-trap experiment measures the anomaly from the difference or ratio of spin-precession and cyclotron frequencies. Inverting the theoretical series gives .
This route is extraordinarily sensitive, but it is not theory-free. The inference uses high-order QED coefficients, hadronic and electroweak contributions, and auxiliary mass ratios. Conversely, inserting an independent recoil value of turns the electron anomaly into a stringent Standard Model test.
Comparing the Published Alpha Inputs
Section titled “Comparing the Published Alpha Inputs”| Route | Reported inverse fine-structure constant | Relative uncertainty | Status |
|---|---|---|---|
| Cs recoil, Parker et al. (2018) | CODATA input | ||
| Rb recoil, Morel et al. (2020) | CODATA input | ||
| Electron anomaly, Fan et al. (2023) plus SM theory | CODATA input | ||
| CODATA 2022 adjusted value | 2022 adjustment |
The Fan result was measured in 2022 and available to the adjustment, although its journal publication appeared in 2023. Eligibility is not determined by the journal year alone.
The caesium and rubidium recoil values differ by
while their original combined standard uncertainty is approximately
Their pairwise separation is therefore about standard deviations if the published uncertainties are treated as independent. Shared adjusted inputs make the full CODATA comparison slightly more subtle, but do not remove the experimental tension. The uncertainty expansion in the 2022 adjustment is why the recommended uncertainty is larger than a naive weighted average would suggest.
These published inputs were not mutually consistent at their original stated uncertainties. Their discrepancy alone does not identify the experiment or theory term responsible. Independent recoil geometries, atomic species, electron-anomaly measurements, and theory cross-checks remain scientifically important.
Retaining the primary observable or , together with its covariance and theory inputs, allows the inferred to be updated when auxiliary masses or calculations improve.
Rydberg Constant
Section titled “Rydberg Constant”Energy scale and adjusted role
Section titled “Energy scale and adjusted role”The Rydberg constant is related to the electron mass and fine-structure constant by
or, equivalently,
It sets the leading electronic binding-energy scale for an infinitely heavy, pointlike nucleus. The subscript refers to the infinite-nuclear-mass limit; actual atomic levels include reduced-mass, relativistic, radiative, recoil, and finite-size corrections.
The exact identity does not make exact. In the present SI, and are exact, whereas and are adjusted. In the CODATA inference network it is convenient to adjust using spectroscopy and connect it to other constants through observational equations.
Hydrogen is a coupled inference
Section titled “Hydrogen is a coupled inference”A schematic hydrogen level can be written
Here includes the reduced-mass relativistic spectrum, includes radiative, recoil, hadronic, and weak contributions at the adopted order, and the displayed nuclear-size term is the leading -state contribution. A transition obeys
At leading nonrelativistic order,
where is the reduced-mass correction for hydrogen. Even this finite-mass formula is not adequate for a precision determination. The proton-radius contribution and leading Lamb-shift terms both have approximately scaling for states. Consequently, one transition generally constrains a combination of , , and QED terms rather than isolating one constant.
Two transitions with sufficiently different sensitivity vectors can determine and under an adopted theory model. A third independent transition can then test that model. Alternatively, a precise proton radius from muonic hydrogen can be supplied as external input, allowing an electronic-hydrogen transition to determine more directly.
Sensitivity and correlation
Section titled “Sensitivity and correlation”For transition , linearize around reference values:
The represent additional constants or theoretical remainder parameters. If two transitions have nearly proportional rows
their combination is poorly conditioned: one direction in space is tightly determined and the orthogonal direction is not. The fitted constants then have a large correlation coefficient,
Publishing only the two marginal uncertainties hides this geometry.
Hydrogen Spectroscopy with an External Radius
Section titled “Hydrogen Spectroscopy with an External Radius”CODATA 2022 recommends
The adjustment expanded selected hydrogen and deuterium transition uncertainties by to address their scatter.
A post-CODATA 2022 result by Maisenbacher and collaborators measured the hydrogen – transition as
Combining it with the hydrogen – frequency gave
with a reported correlation of approximately between the inferred and . Using the muonic-hydrogen radius as an input instead gave
This latter uncertainty is smaller than the CODATA 2022 uncertainty, and the central values are compatible. The result also tests the Standard Model prediction for the measured transition at parts per trillion and the relevant bound-state QED contribution at about parts per million.
This 2026 example shows how an external radius narrows a spectroscopic fit. It is an experimental inference using specified theory, not the result of a new global adjustment.
Systematics and theory limitations
Section titled “Systematics and theory limitations”Hydrogen spectroscopy at this level depends on:
- first- and second-order Doppler effects and the velocity distribution;
- quantum-interference and line-pulling effects among nearby resonances;
- ac and dc Stark shifts, Zeeman shifts, and blackbody radiation;
- frequency-reference and comb traceability;
- recoil and reduced-mass corrections;
- proton charge and magnetic structure;
- correlated bound-state QED remainders; and
- the line-shape model used to map detected counts to an unperturbed frequency.
The Rydberg Formula provides the historical and leading-order spectral structure. It should not be substituted for the full observational equation in a modern constant determination.
Electron-to-Proton Mass Ratio
Section titled “Electron-to-Proton Mass Ratio”A convention worth stating
Section titled “A convention worth stating”Both
and its inverse
occur in the literature. The symbol is also used for reduced mass and magnetic moment, so a precision report should define its notation explicitly. CODATA 2022 gives
These are dimensionless ratios. The proton and electron masses in kilograms additionally depend on the SI realization and the atomic mass constant.
Cyclotron-frequency mass spectrometry
Section titled “Cyclotron-frequency mass spectrometry”An ideal ion of mass and charge in a uniform magnetic field has free cyclotron frequency
For two ions measured in the same field,
The magnetic field cancels only to the extent that the two frequencies sample the same field in time and space. Precision experiments alternate or simultaneously store ions, interpolate magnetic-field drift, control trap anharmonicities, and compare motional energies.
In a real Penning trap, the electrostatic potential splits the motion into modified cyclotron, axial, and magnetron modes. The Brown–Gabrielse invariance theorem gives, to first order in important trap imperfections,
The measured ion mass is not automatically the neutral-atom, nuclear, or bare-particle mass needed by an adjustment. For an ion with remaining electrons,
with the sign convention that . Electron binding energies, ionization energies, molecular dissociation energies, and their uncertainties must be applied at the precision of the mass ratio.
Bound-electron g-factor route
Section titled “Bound-electron g-factor route”The electron mass is too small for the most precise direct comparison with ordinary heavy reference ions. A powerful alternative stores a hydrogenlike ion and measures both its cyclotron frequency and the Larmor frequency of its bound electron.
For ion charge and mass ,
while the bound-electron spin frequency is
Their ratio gives
The cancellation of is experimental; the extraction of is theory-dependent through . That calculation includes Dirac binding, radiative, recoil, nuclear-size, and nuclear-polarization terms. Sturm and collaborators used this route with hydrogenlike to determine the electron’s relative atomic mass.
Molecular-ion spectroscopy
Section titled “Molecular-ion spectroscopy”The rovibrational energies of a light molecular ion depend strongly on nuclear-to-electron mass ratios. In a Born–Oppenheimer scaling estimate,
Here energies are measured relative to a fixed electronic scale, and is the nuclear reduced mass in electron-mass units. For the following simple derivatives, all nuclear masses scale together with while their ratios and the electronic scale stay fixed:
in simple limiting models. Actual three-body calculations include nonadiabatic, relativistic, radiative, finite-size, spin, and external-field effects.
For transition in a molecular hydrogen ion, write
The measurement constrains the parameter combination to which is sensitive. A statement that spectroscopy “measured the proton mass” is therefore incomplete unless it specifies the other fixed or adjusted inputs and the ab initio theory covariance.
High-accuracy work has provided a spectroscopic route to the mass ratio. Patra and collaborators measured a overtone with a fractional frequency uncertainty of parts per trillion and inferred at a fractional uncertainty of about parts per trillion. CODATA 2022 included molecular-hydrogen-ion spectroscopy in its mass adjustment.
In 2025, Alighanbari and collaborators measured an rovibrational transition with an fractional uncertainty. Their restricted least-squares analysis obtained
consistent with both CODATA 2022 and the spectroscopic determination. The two molecular results are complementary but partially correlated: they share apparatus, theoretical methods, numerical routines, and hydrogen/deuterium and muonic-atom inputs (Alighanbari and colleagues, 2025). Their agreement tests consistency across species; a joint comparison must retain those shared uncertainties. This post-CODATA result had a smaller uncertainty than the earlier bound-electron--factor determination, although not smaller than the CODATA 2022 global-adjustment uncertainty.
The value is a spectroscopic inference under the adopted molecular, hydrogen, and muonic-hydrogen theory inputs. That dependence is a feature: agreement between mass spectrometry, bound-electron spin resonance, and molecular spectroscopy tests a much wider network than repeated use of one apparatus class.
A mass-ratio result is a closure test
Section titled “A mass-ratio result is a closure test”Suppose three independent routes determine
They must satisfy
Define the logarithmic closure residual
Its uncertainty must include cross-covariances. A statistically significant nonzero value could indicate an experimental bias, a binding energy error, an incomplete theory model, or a new interaction. Closure alone does not identify the cause.
Magnetic Moments
Section titled “Magnetic Moments”Magnetons and g factors
Section titled “Magnetons and g factors”The Bohr and nuclear magnetons are
They are convenient scale units, not independently adjusted particle moments. Since they contain and , their SI values inherit mass uncertainties even though and are exact.
For angular momentum , define
The reference magneton and charge-sign convention must be stated. For an electron, , so its magnetic moment is antiparallel to its spin for positive . CODATA tabulates the signed ratio
For a nucleus of spin ,
The proton has
whereas the neutron has a negative moment. Composite-particle factors encode internal strong-interaction structure; they are not fixed by spin alone.
Magnetic Moments and g Factors explains angular-momentum conventions and Zeeman Hamiltonians. Here the emphasis is determining their numerical coefficients.
Larmor-to-cyclotron ratio
Section titled “Larmor-to-cyclotron ratio”For a free charged spin- particle with and mass ,
Therefore,
The ratio cancels the magnetic field to first order. In a high-precision trap, however, the spin transition and motional frequencies may be measured in different trap regions or at different times. Magnetic-field drift, image-charge shifts, relativistic motional shifts, electric-field imperfections, and spin-state detection all enter the uncertainty budget.
The 2023 free-electron measurement reported
CODATA combines it with theory and other input data rather than simply copying this number into every related entry.
For the proton, a double-trap method separates precision frequency measurement in a homogeneous field from spin-state analysis in a strong magnetic bottle. Schneider and collaborators obtained
at parts per billion. The last displayed digit of the CODATA 2022 adjusted value differs because the recommendation comes from a correlated network and uses its own rounding.
Free, bound, and shielded moments
Section titled “Free, bound, and shielded moments”A magnetic moment measured in an atom, molecule, liquid, or solid is not automatically the free-particle moment. Electronic currents shield the local field at a nucleus:
where is generally a tensor. In an isotropic sample,
defines a shielded moment . Extracting requires a calculated or independently measured shielding correction.
A high-precision NMR ratio must therefore state:
- the molecule or material and isotopic composition;
- chemical state, solvent, concentration, and temperature;
- sample shape and demagnetization convention;
- whether the quoted quantity is free, bound, or shielded;
- the shielding calculation and its uncertainty; and
- correlations introduced by a common reference sample.
Labels such as “proton moment in water at ” are not decorative metadata. They define the measurand.
Hyperfine spectroscopy
Section titled “Hyperfine spectroscopy”For an electron, the leading Fermi-contact interaction has the form
The corresponding hyperfine interval is sensitive to a product of magnetic moments and the wavefunction at the nucleus. A precision prediction also includes relativistic, radiative, recoil, nuclear magnetization-distribution, nuclear polarizability, and finite-charge-size corrections.
Consequently, hyperfine spectroscopy can determine a moment ratio only after atomic or molecular structure theory separates these contributions. For hydrogen, the Zemach radius and proton polarizability become limiting nuclear-structure terms. For many-electron atoms, electronic correlation and shielding can dominate. A precise interval is not by itself a theory-independent free nuclear moment.
Moment ratios and conversion chains
Section titled “Moment ratios and conversion chains”Experiments often compare two moments more directly than either absolute moment:
This signed relation uses signed frequencies proportional to the signed gyromagnetic ratios and stretched-state moments; for positive frequency magnitudes it determines , not its sign. Both shielding factors are assumed scalar and positive. Here the subscript names the second species, rather than the Bohr magneton. Tensor shielding requires the corresponding orientation-dependent response.
To convert a measured shielded ratio into , an adjustment may need:
- another magnetic-moment ratio;
- one or more shielding differences;
- the electron-to-proton mass ratio;
- the electron anomaly or a bound-electron factor; and
- covariance among all these inputs.
This long conversion chain explains why CODATA magnetic-moment tables contain many correlated entries and why a local update can propagate beyond the originally measured species.
Spectroscopy as a Constants Experiment
Section titled “Spectroscopy as a Constants Experiment”The forward model
Section titled “The forward model”A precision spectrum becomes a constants experiment only through a forward model. For line ,
where contains constants of interest and contains nuisance parameters, field shifts, line-shape parameters, and theoretical remainders. The measured line centre is
Here represents applied or fitted experimental corrections and the residual stochastic error under the adopted model.
The laboratory problem and the constants problem should be separated:
The first line belongs to frequency metrology and line-shape inference. The second belongs to the constants adjustment. Combining them in one opaque fit can make systematic corrections and shared theory errors difficult to distinguish.
Logarithmic sensitivity coefficients
Section titled “Logarithmic sensitivity coefficients”Choose a fixed reference frequency scale and other independent parameters. For a dimensionless constant , define
Small changes then obey
Sensitivity coefficients expose three distinct questions:
- leverage: how much does the line move when a constant changes?
- identifiability: are the sensitivity vectors of available lines linearly independent?
- robustness: does a useful combination suppress a common nuisance or theory term?
A line with a large is not automatically the best measurement. It may be broad, field-sensitive, theoretically uncertain, or nearly degenerate with another parameter.
Frequency ratios
Section titled “Frequency ratios”For a ratio ,
A common dimensional energy scale cancels when . This is why clock and molecular frequency ratios are powerful probes of dimensionless combinations. The cancellation can also reduce sensitivity to a constant one intended to determine, so the ratio must be designed for the scientific target rather than assumed to be universally superior.
Theory uncertainty as data
Section titled “Theory uncertainty as data”An uncalculated contribution should not be hidden inside prose. One useful model introduces a theory nuisance parameter with prior covariance :
For zero-mean theory parameters independent of experimental noise, their linear contribution to the covariance is
For a Gaussian prior this is also the covariance obtained by Gaussian marginalization. It preserves shared theory errors across several lines. Treating the same omitted QED coefficient as independent noise in every transition would overstate the information content of the dataset.
Theory errors should be classified:
- numerical convergence or basis-set uncertainty;
- uncertainty propagated from input constants;
- uncertainty in nuclear radii, polarizabilities, or structure;
- truncation of a controlled perturbation series;
- estimated uncalculated terms with shared coefficients; and
- model discrepancy that is not justified by a probabilistic expansion.
The last category should not be assigned a tiny Gaussian uncertainty merely because the fit software requires one.
Designing an identifiable measurement set
Section titled “Designing an identifiable measurement set”Let contain the logarithmic sensitivities defined above and be the covariance of fractional (or linearized log) frequencies, including theory contributions. The local information matrix for is
If instead is in squared Hz, use the Jacobian and . Mixing dimensionless with gives the wrong units and weighting. Small eigenvalues identify poorly constrained combinations of constants. Good experimental design can improve them by selecting:
- transitions with complementary sensitivities;
- isotopologues that change mass and nuclear-size dependence;
- ratios that cancel dominant common shifts;
- field-reversal or state-reversal channels that isolate nuisance terms;
- direct mass or radius inputs that rotate a spectroscopic degeneracy; and
- measurements from independent apparatus classes.
The determinant or condition number of can guide design, but must be interpreted with physically meaningful parameter scaling.
Common Pitfalls
Section titled “Common Pitfalls”A converted constant inherits auxiliary assumptions. Recoil measures through an apparatus model; extracting also uses masses and . Molecular frequencies similarly require molecular theory.
A newer measurement is not a new global adjustment. Keep the edition of recommended values distinct from the dates of individual papers.
Shared errors do not average independently. A common QED remainder or calibration creates off-diagonal covariance. Omitting it can either raise or lower the uncertainty of a derived quantity.
A fitted input is not an independent theory test. Inserting an electron-anomaly determination of back into the same anomaly formula largely reproduces the input. A recoil value supplies a separate test of that high-order QED relation.
Charge state and chemical environment matter. Ion, neutral-atom, nuclear, free-moment, and shielded-moment values are different quantities. Binding energies and shielding corrections connect them.
Exercises
Section titled “Exercises”Exercise 1: Derive the recoil observational equation
Section titled “Exercise 1: Derive the recoil observational equation”Starting from
derive an expression for in terms of , , , and . Identify which factor an atom-recoil apparatus most directly determines.
Solution
Solve the Rydberg identity for :
Insert
Therefore,
The interferometric apparatus most directly determines , after its phase, wavevector, geometry, and systematic corrections are modelled. and the relative masses are auxiliary adjusted inputs.
Exercise 2: Recoil frequency and scaling
Section titled “Exercise 2: Recoil frequency and scaling”For at wavelength , estimate the single-photon recoil frequency
Use and . Then explain why large momentum transfer is useful when is only a few kilohertz.
Solution
The atomic mass is approximately
Hence
The recoil itself is small compared with optical frequencies. Coherent transfer of many photon momenta accumulates a phase proportional to a large integer multiple of the recoil, improving statistical leverage. This does not automatically reduce wavefront, diffraction-phase, or trajectory systematics; those can also scale with the pulse sequence.
Exercise 3: Quantify the recoil discrepancy
Section titled “Exercise 3: Quantify the recoil discrepancy”Treat the 2018 caesium and 2020 rubidium values as independent:
Compute their difference in units of the combined standard uncertainty. What would multiplying both uncertainties by do to this pairwise normalized separation?
Solution
The absolute difference is
The independent combined uncertainty is
Thus
If both marginal uncertainties are multiplied by , the denominator is also multiplied by , giving
This demonstrates what uncertainty expansion does numerically. It reduces the normalized tension used by the adjustment, but it does not discover the cause or make the original experiments agree at their published uncertainties.
Exercise 4: Two-transition conditioning
Section titled “Exercise 4: Two-transition conditioning”Consider the linearized model
with equal independent frequency uncertainties . Interpret as a scaled shift and as a scaled shift. Solve for and . How does the uncertainty behave as ?
Solution
Subtract the two equations:
so
Because the two measurements are independent,
Thus , and the uncertainty of also diverges. At , the two sensitivity rows are identical and only is identifiable. The example captures why nominally precise hydrogen transitions can leave and highly correlated.
Exercise 5: Charge states and binding energy
Section titled “Exercise 5: Charge states and binding energy”Two ions have charges and . Their measured free-cyclotron frequency ratio is
Find in the ideal model. Then write the correction needed if ion 1 was formed from a neutral atom by removing five electrons with total ionization energy .
Solution
The ideal ratio is
If neutral atom 1 has mass , then
The positive term appears because removing bound electrons requires energy: the neutral atom’s binding lowers its mass relative to the separated constituents. Therefore,
The trap ratio determines the ion mass. The electron masses and total ionization energy must be included before quoting the neutral-atom mass.
Exercise 6: Molecular sensitivity
Section titled “Exercise 6: Molecular sensitivity”In a simple model, a vibrational transition satisfies
If the measured frequency is with a fractional uncertainty of and all other contributions are exact, estimate the best possible fractional uncertainty in . Why is this only a lower bound for a real molecular-ion determination?
Solution
Taking logarithms gives
Therefore,
This is a lower bound because real theory also depends on , other nuclear mass ratios, charge radii, , relativistic and QED terms, hyperfine deperturbation, and external-field corrections. Their uncertainties and correlations must be included.
Exercise 7: g factor and sign
Section titled “Exercise 7: g factor and sign”A trapped electron has measured magnitude ratio
Find and . Why is the signed ratio negative even though both numbers just calculated are positive?
Solution
Since
we obtain
The anomaly is
The electron charge is negative. Its magnetic moment vector is therefore antiparallel to its spin vector under the common convention, so . Frequency magnitudes discard this orientation sign; recovering it requires the declared Hamiltonian and charge convention.
Exercise 8: Propagating a Correlated Pair
Section titled “Exercise 8: Propagating a Correlated Pair”Let a derived quantity be
Suppose
Compute . Compare with the value obtained by incorrectly assuming independence.
Solution
The covariance is
For ,
Thus
Assuming independence would give
Positive correlation reduces uncertainty in a difference. For a sum, the same covariance would increase it. Dropping covariance is not automatically conservative.
An exact example is in the SI. Both factors depend on the measured , with opposite logarithmic derivatives. Their perfectly anticorrelated fractional uncertainties cancel from the product. Treating the two quoted uncertainties as independent would assign a spurious uncertainty to .
Related Reading
Section titled “Related Reading”- Variation searches uses sensitivity differences to test temporal or spatial changes.
- Atom-interferometric sensors develops recoil phase, wavefront effects, and calibration.
- Constants and conversions supplies unit conversions and links to recommended numerical datasets.
References
Section titled “References”- S. Alighanbari, G. S. Giri, F. L. Constantin, V. I. Korobov, and S. Schiller, Precise test of quantum electrodynamics and determination of fundamental constants with ions, Nature 581, 152–158 (2020).
- S. Alighanbari, M. R. Schenkel, V. I. Korobov, and S. Schiller, High-accuracy laser spectroscopy of and the proton–electron mass ratio, Nature 644, 69–75 (2025).
- A. Antognini, F. Nez, K. Schuhmann, et al., Proton structure from the measurement of – transition frequencies of muonic hydrogen, Science 339, 417–420 (2013).
- T. Aoyama, T. Kinoshita, and M. Nio, Theory of the anomalous magnetic moment of the electron, Atoms 7, 28 (2019).
- A. Beyer, L. Maisenbacher, A. Matveev, et al., The Rydberg constant and proton size from atomic hydrogen, Science 358, 79–85 (2017).
- BIPM, The International System of Units, ninth edition, SI Brochure, updated version.
- R. D. Deslattes, P. J. Mohr, and B. N. Taylor, Introduction to the constants for nonexperts, NIST Fundamental Constants Data Center.
- X. Fan, T. G. Myers, B. A. D. Sukra, and G. Gabrielse, Measurement of the electron magnetic moment, Phys. Rev. Lett. 130, 071801 (2023).
- D. J. Fink and E. G. Myers, Deuteron-to-proton mass ratio from simultaneous measurement of the cyclotron frequencies of and , Phys. Rev. Lett. 127, 243001 (2021).
- J. L. Flowers, B. W. Petley, and M. G. Richards, A measurement of the nuclear magnetic moment of the proton in water, Metrologia 30, 75–87 (1993).
- A. Grinin, A. Matveev, D. C. Yost, et al., Two-photon frequency comb spectroscopy of atomic hydrogen, Science 370, 1061–1066 (2020).
- D. Hanneke, S. Fogwell, and G. Gabrielse, New measurement of the electron magnetic moment and the fine structure constant, Phys. Rev. Lett. 100, 120801 (2008).
- F. Heiße, F. Köhler-Langes, S. Rau, et al., High-precision measurement of the proton’s atomic mass, Phys. Rev. Lett. 119, 033001 (2017).
- I. V. Kortunov, S. Alighanbari, M. G. Hansen, et al., Proton–electron mass ratio by high-resolution optical spectroscopy of ion ensembles in the resolved-carrier regime, Nat. Phys. 17, 569–573 (2021).
- L. Maisenbacher, V. Wirthl, A. Matveev, et al., Sub-part-per-trillion test of the Standard Model with atomic hydrogen, Nature 650, 845–851 (2026).
- P. J. Mohr, D. B. Newell, B. N. Taylor, and E. Tiesinga, CODATA recommended values of the fundamental physical constants: 2022, Rev. Mod. Phys. 97, 025002 (2025).
- P. J. Mohr, D. B. Newell, B. N. Taylor, and E. Tiesinga, CODATA recommended values of the fundamental physical constants: 2022, J. Phys. Chem. Ref. Data 54, 033105 (2025). This parallel publication includes detailed input tables, observational equations, correlations, and adjustment diagnostics.
- A. Mooser, H. Kracke, K. Blaum, et al., Direct high-precision measurement of the magnetic moment of the proton, Nature 509, 596–599 (2014).
- L. Morel, Z. Yao, P. Cladé, and S. Guellati-Khélifa, Determination of the fine-structure constant with an accuracy of 81 parts per trillion, Nature 588, 61–65 (2020).
- NIST Fundamental Constants Data Center, Current CODATA values and 2026 adjustment schedule.
- R. H. Parker, C. Yu, W. Zhong, B. Estey, and H. Müller, Measurement of the fine-structure constant as a test of the Standard Model, Science 360, 191–195 (2018).
- C. G. Parthey, A. Matveev, J. Alnis, et al., Improved measurement of the hydrogen – transition frequency, Phys. Rev. Lett. 107, 203001 (2011).
- S. Patra, M. Germann, J.-P. Karr, et al., Proton-electron mass ratio from laser spectroscopy of at the part-per-trillion level, Science 369, 1238–1241 (2020).
- W. D. Phillips, W. E. Cooke, and D. Kleppner, Magnetic moment of the proton in in Bohr magnetons, Metrologia 14, 179–183 (1978).
- R. Pohl, A. Antognini, F. Nez, et al., The size of the proton, Nature 466, 213–216 (2010).
- G. Schneider, A. Mooser, M. Bohman, et al., Double-trap measurement of the proton magnetic moment at 0.3 parts per billion precision, Science 358, 1081–1084 (2017).
- S. Sturm, F. Köhler, J. Zatorski, et al., High-precision measurement of the atomic mass of the electron, Nature 506, 467–470 (2014).