

Wave-Mechanics Visualization Gallery
A quantum plot becomes easier to understand when you identify both the plotted quantity and its measure. The examples below contrast density with amplitude, radial shell probability with local density, and a gauge transformation with a change of basis. For a visual tour of the models, see Canonical Plots Gallery.
A Spreading Packet Keeps Its Total Probability
Section titled “A Spreading Packet Keeps Its Total Probability”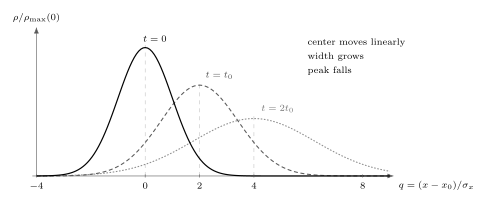
An initially unchirped Gaussian at , where . The horizontal coordinate is , and the density is divided by its initial peak. The center travels two initial widths per . The full curves have equal area even though their peak heights differ.
The probability of a region is the area under its density curve. As the packet spreads, a fixed small interval around its center generally contains less probability, while more lies in the tails. A peak height alone does not give the chance of finding the particle in a finite interval. Derive the width in Gaussian Wave Packets.
Radial Probability Includes the Size of a Shell
Section titled “Radial Probability Includes the Size of a Shell”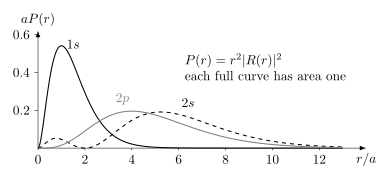
Radial shell probabilities for hydrogenic , , and states as functions of , with the ionic Bohr length. The vertical axis is the dimensionless density ; each full curve has area one in . The node is at .
For a normalized angular factor, is the density with respect to . The local density is greatest at the origin, but the probability per radial interval vanishes there because a shell has vanishing volume. Its maximum occurs at . The distinction is developed in Radial Probability Distributions.
Gauge Changes and Basis Changes
Section titled “Gauge Changes and Basis Changes”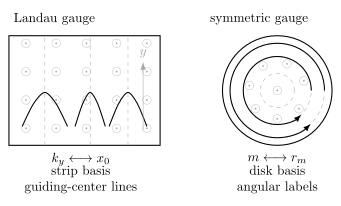
Two convenient bases for the same ideal bulk Landau-level problem: translation-adapted states labeled by a guiding center, and rotation-adapted states labeled by angular momentum. The outlines illustrate coordinate regions rather than imposed hard boundaries; arrows are schematic labels, not particle trajectories.
A gauge transformation multiplies the wavefunction of the same state by a phase and leaves unchanged. The different shapes here arise because one also chooses different basis states within a degenerate energy eigenspace. To compare the same state across gauges, transform the whole state, including the appropriate superposition coefficients. See Landau Gauge vs Symmetric Gauge.
Exercises
Section titled “Exercises”- Can a negative part of a plotted wavefunction represent a negative probability?
Solution
No. A real amplitude can change sign, and a complex amplitude has a phase. Probability density is its nonnegative modulus squared. Opposite signs still matter when amplitudes interfere.
- A normalized Gaussian has twice its original width. What happens to its peak density?
Solution
For , the peak is . Doubling halves the peak, preserving total area one.
References
Section titled “References”- D. J. Griffiths and D. F. Schroeter, Introduction to Quantum Mechanics, 3rd ed., Cambridge University Press, 2018, chapters 2, 4, and 10.
- R. Shankar, Principles of Quantum Mechanics, 2nd ed., Springer, 1994, chapters 5, 12, and 14.